Dashboard Analysis
Hired HR's leadership opens one portal and sees everything: pipeline value in EGP, filling rate on open jobs, project completion %, total cash balance across five accounts and active performance cycles. Each domain dashboard is purpose-built for the team using it — sales sees deals, recruiting sees candidates, ops sees tasks, finance sees aging — but every figure reconciles back to the same source-of-truth tables.

Every section, explained.
5 working sections inside Dashboard Analysis — each one a screen we designed, built and tested in the live system.
Unified Admin Dashboard
The landing screen leadership opens every morning — one surface fusing the five domain dashboards so pipeline, headcount, project status and cash all sit on the same page. Driven by a single date-range filter and the shared schema underneath every module.
- Single landing screen across all seven domains
- Date-range filter applied portfolio-wide
- Drill-through from any tile to the underlying module
- Cross-domain KPIs reconciled to one source of truth
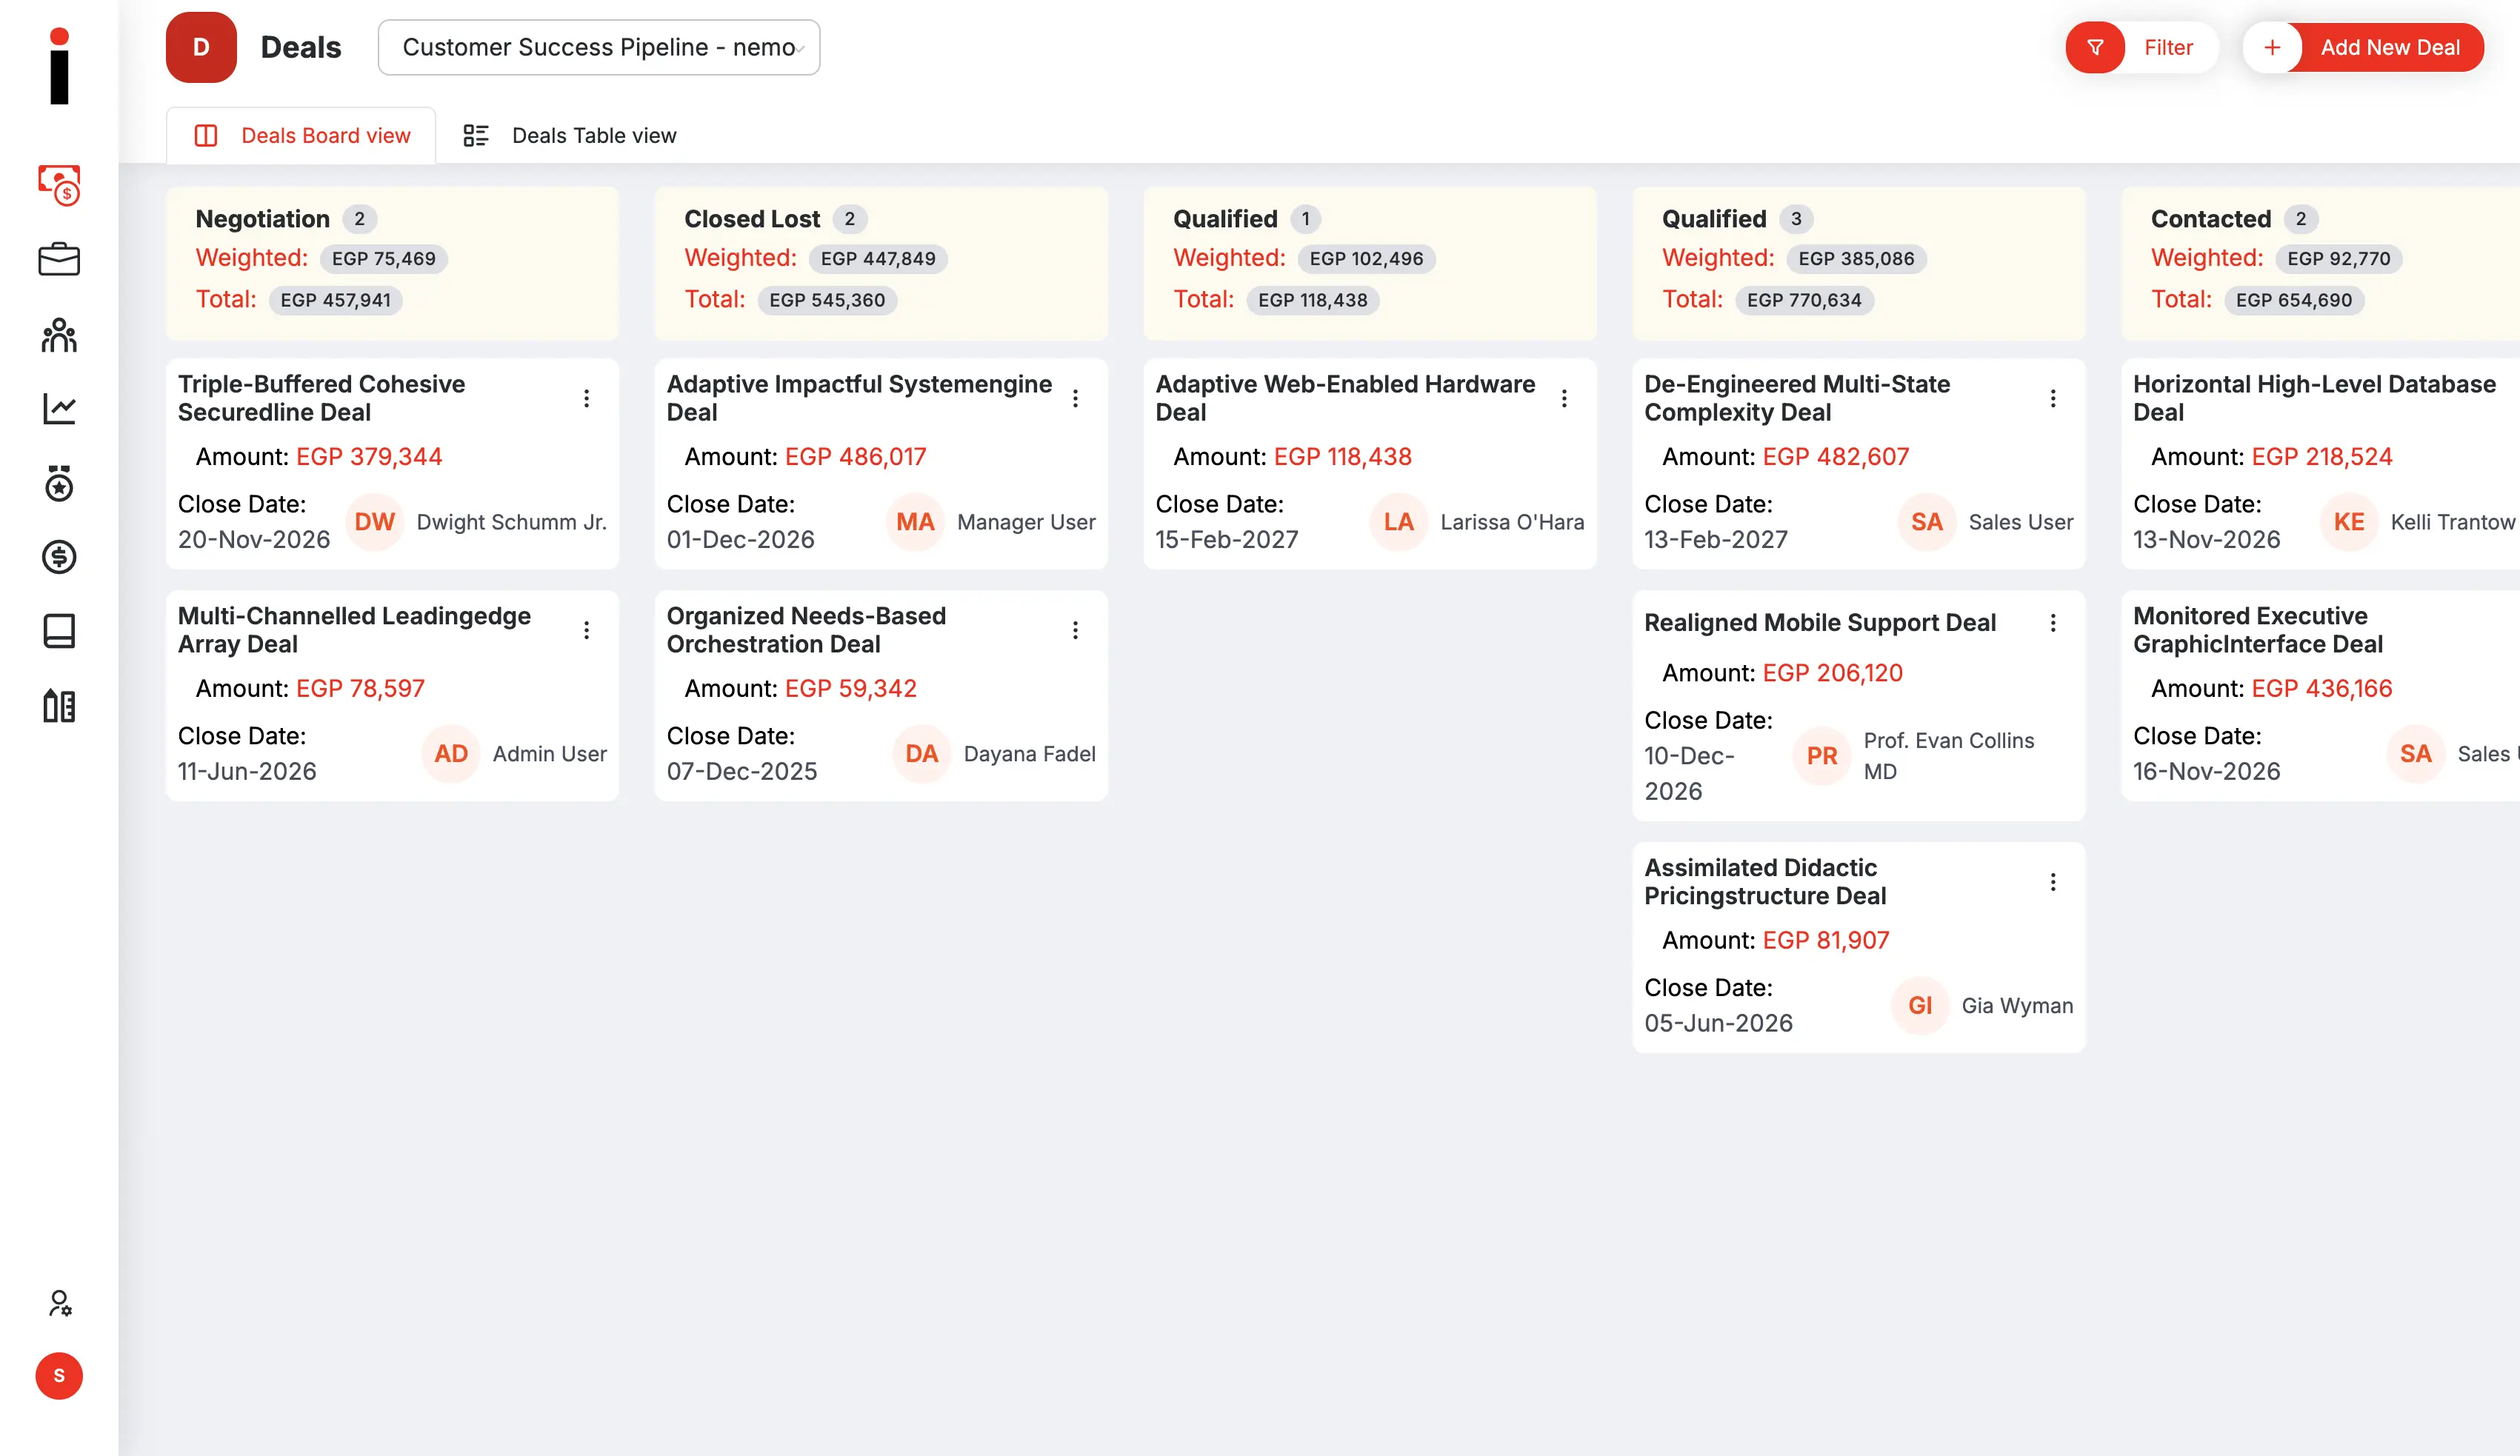
CRM Sales Dashboard
Deal stats (Won / Lost / Open / Paid / Unpaid), a pipeline bar chart, a paid-vs-unpaid donut and EGP totals — surfaces the EGP 15.27M of pending pipeline across the 60 active deals in one screen.
- Deal stats — Won / Lost / Open / Paid / Unpaid
- Pipeline bar chart with EGP totals
- Paid-vs-unpaid donut at the top of the view
- EGP 15.27M total pending across 60 deals
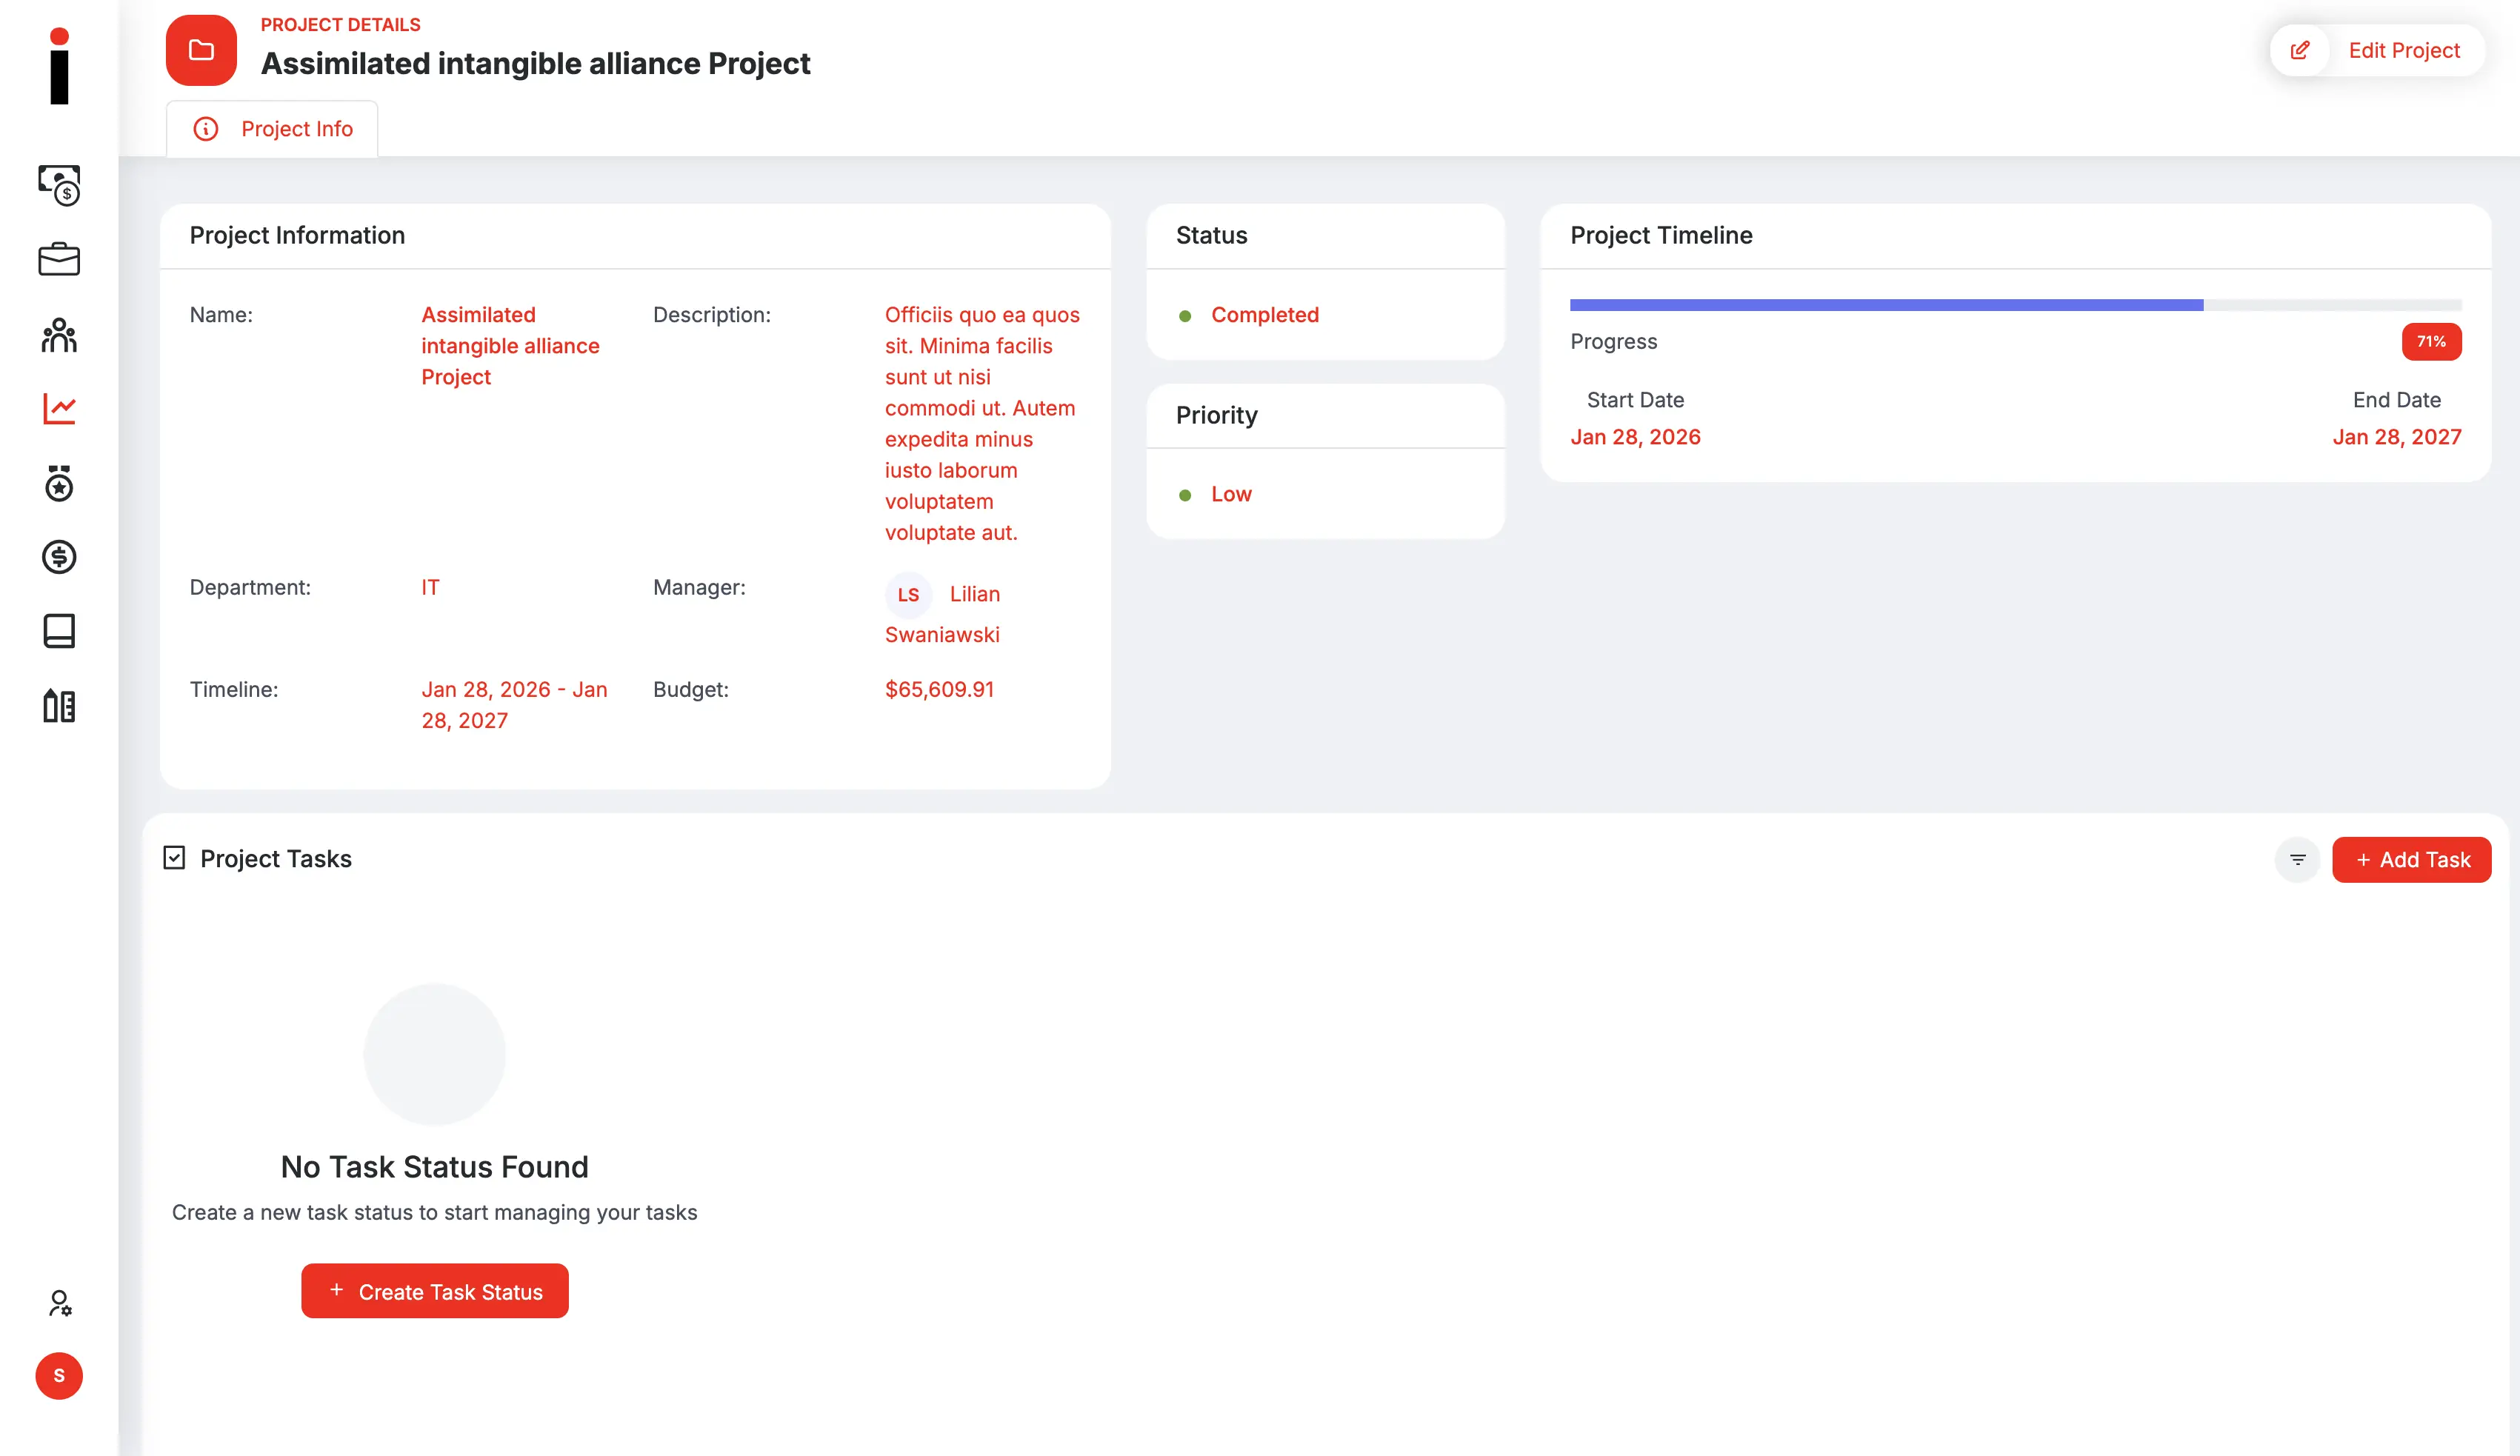
Projects Business
The ops business view across 25 projects and 100 tasks — completion percentages, Time Logged (today / week), Project Status donut and a Tasks by Priority bar chart — with the 41 Task Managers permission tier surfaced live.
- Projects & Tasks completion percentages
- Time Logged (today / week) counters
- Project Status donut + Tasks by Priority bar chart
- 41 Task Managers with PM authority surfaced
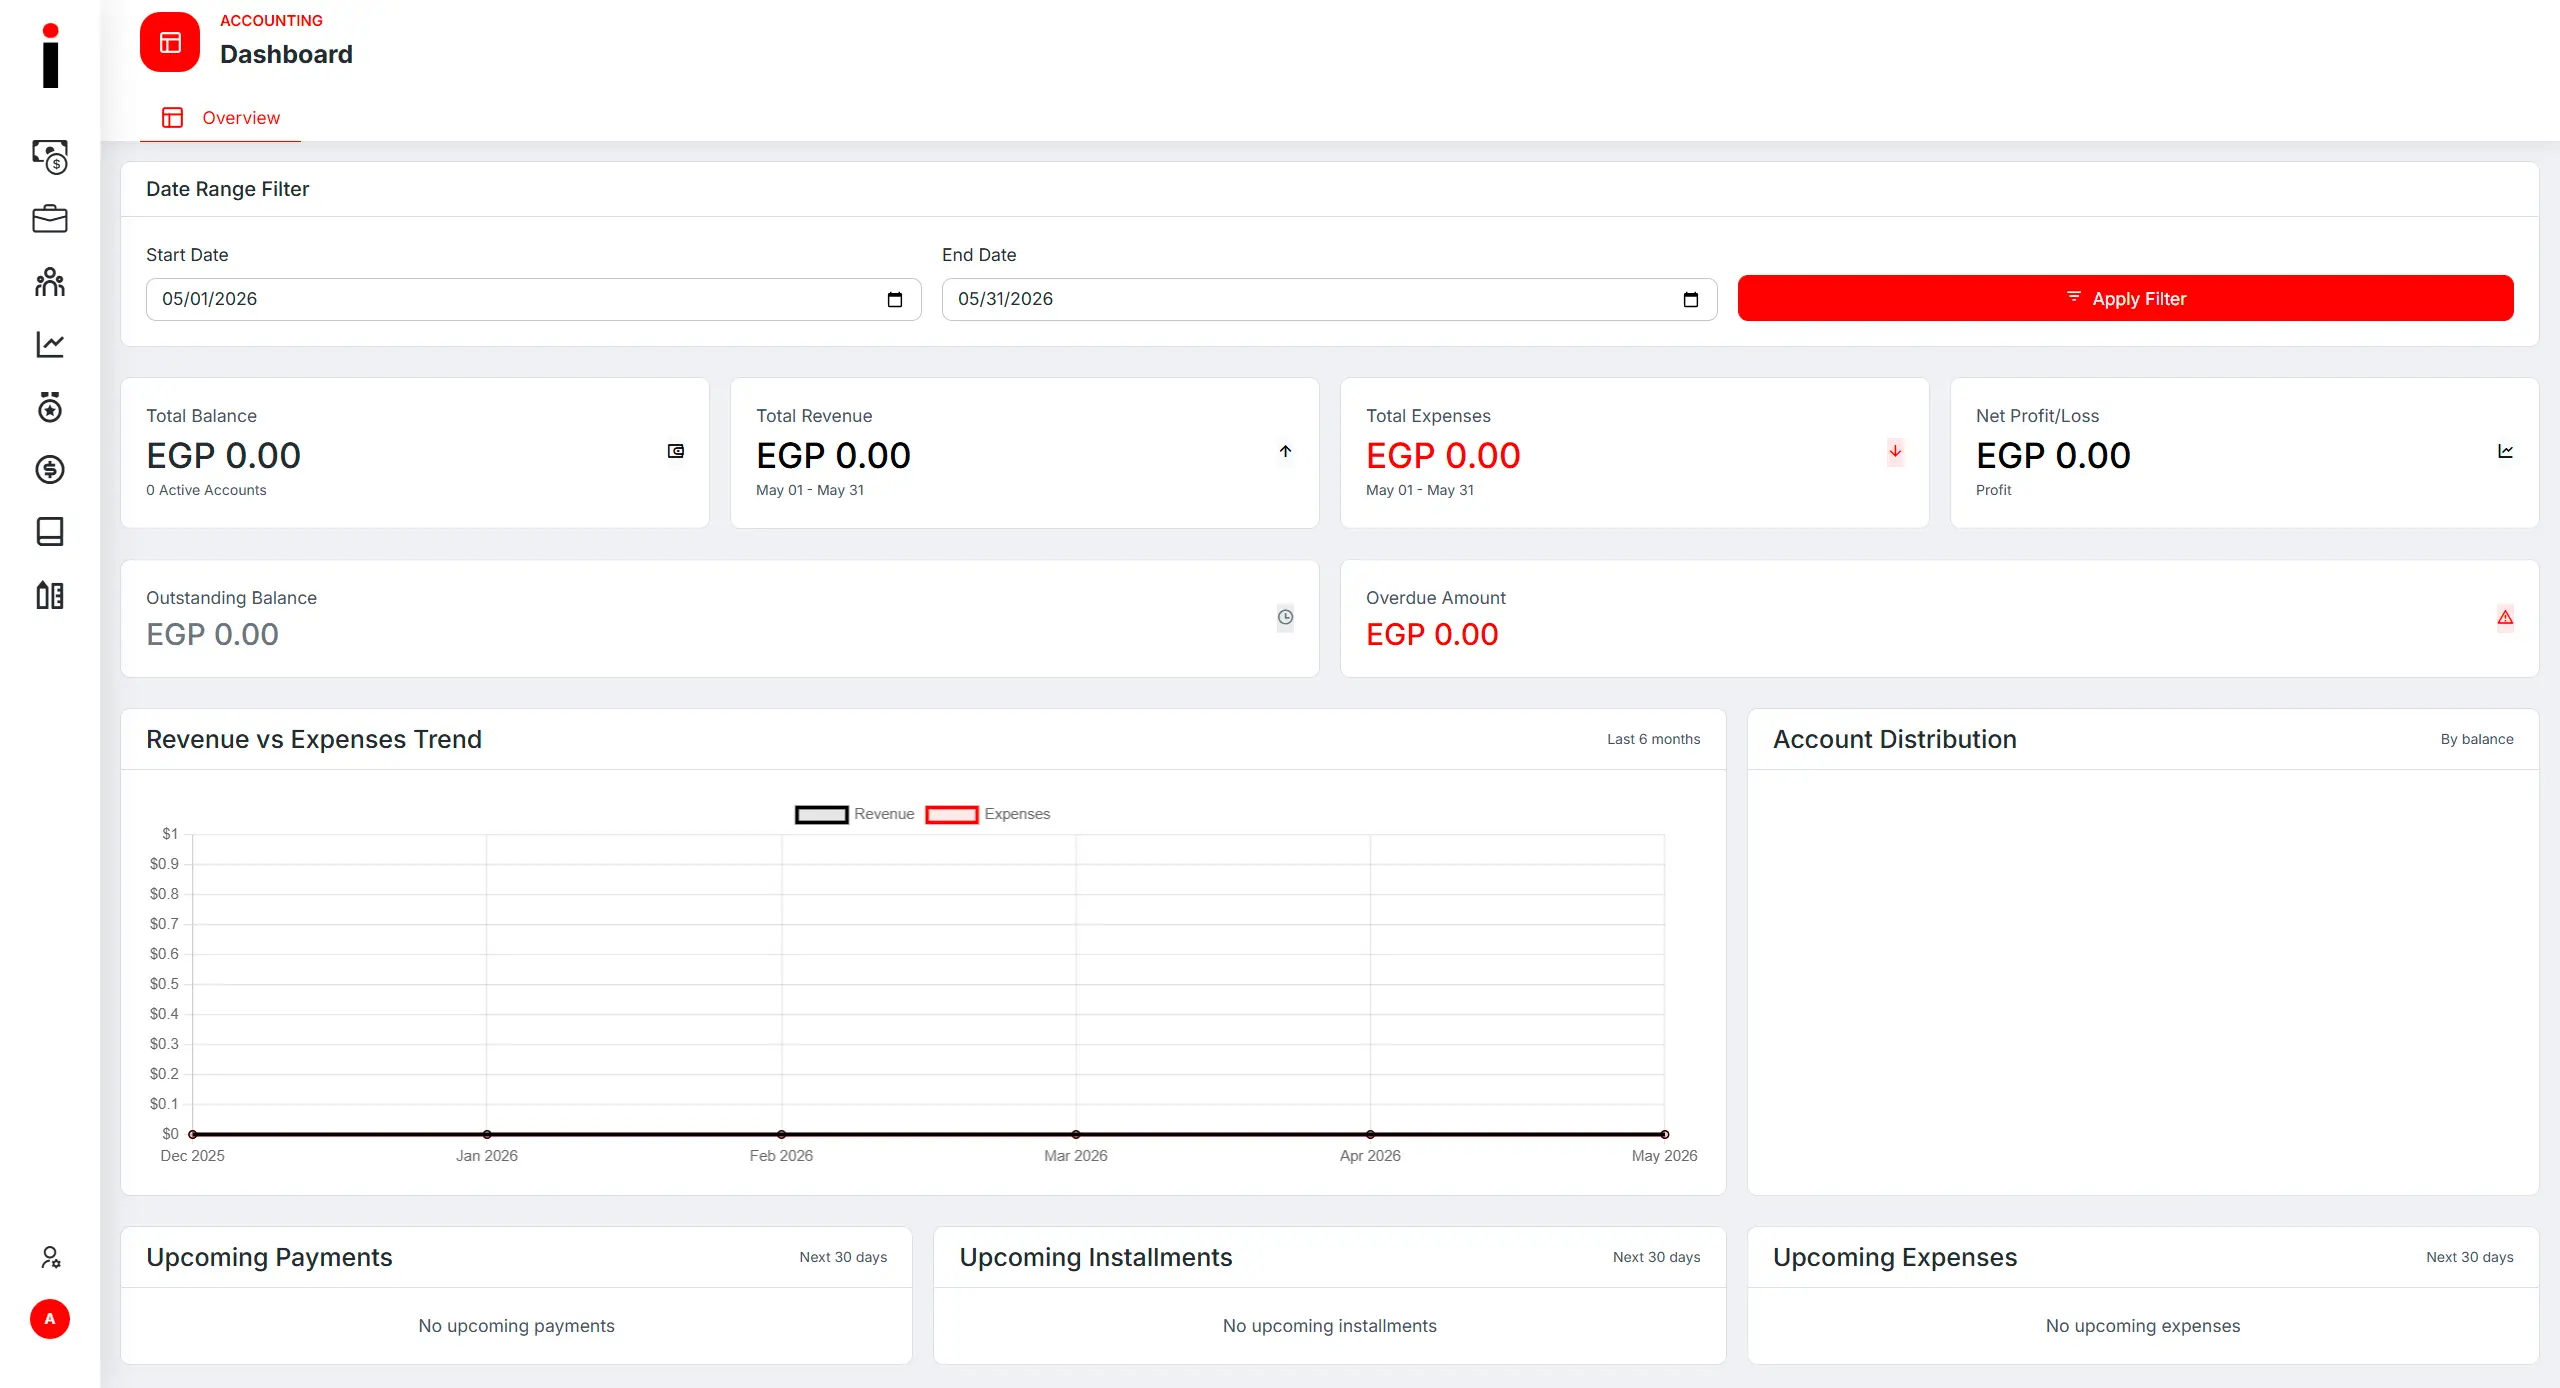
Accounting Financial Dashboard
Total Balance EGP 480k across 5 accounts, Revenue / Expense trend chart, Account Distribution donut and an Outstanding aging report with red overdue badges on the 14 / 17 / 31 / 40 / 89-day buckets.
- Total Balance EGP 480k across 5 accounts
- Revenue / Expense trend chart with month filter
- Account Distribution donut (Main / Savings / Payroll / Investment / Petty)
- Outstanding aging report with red overdue badges
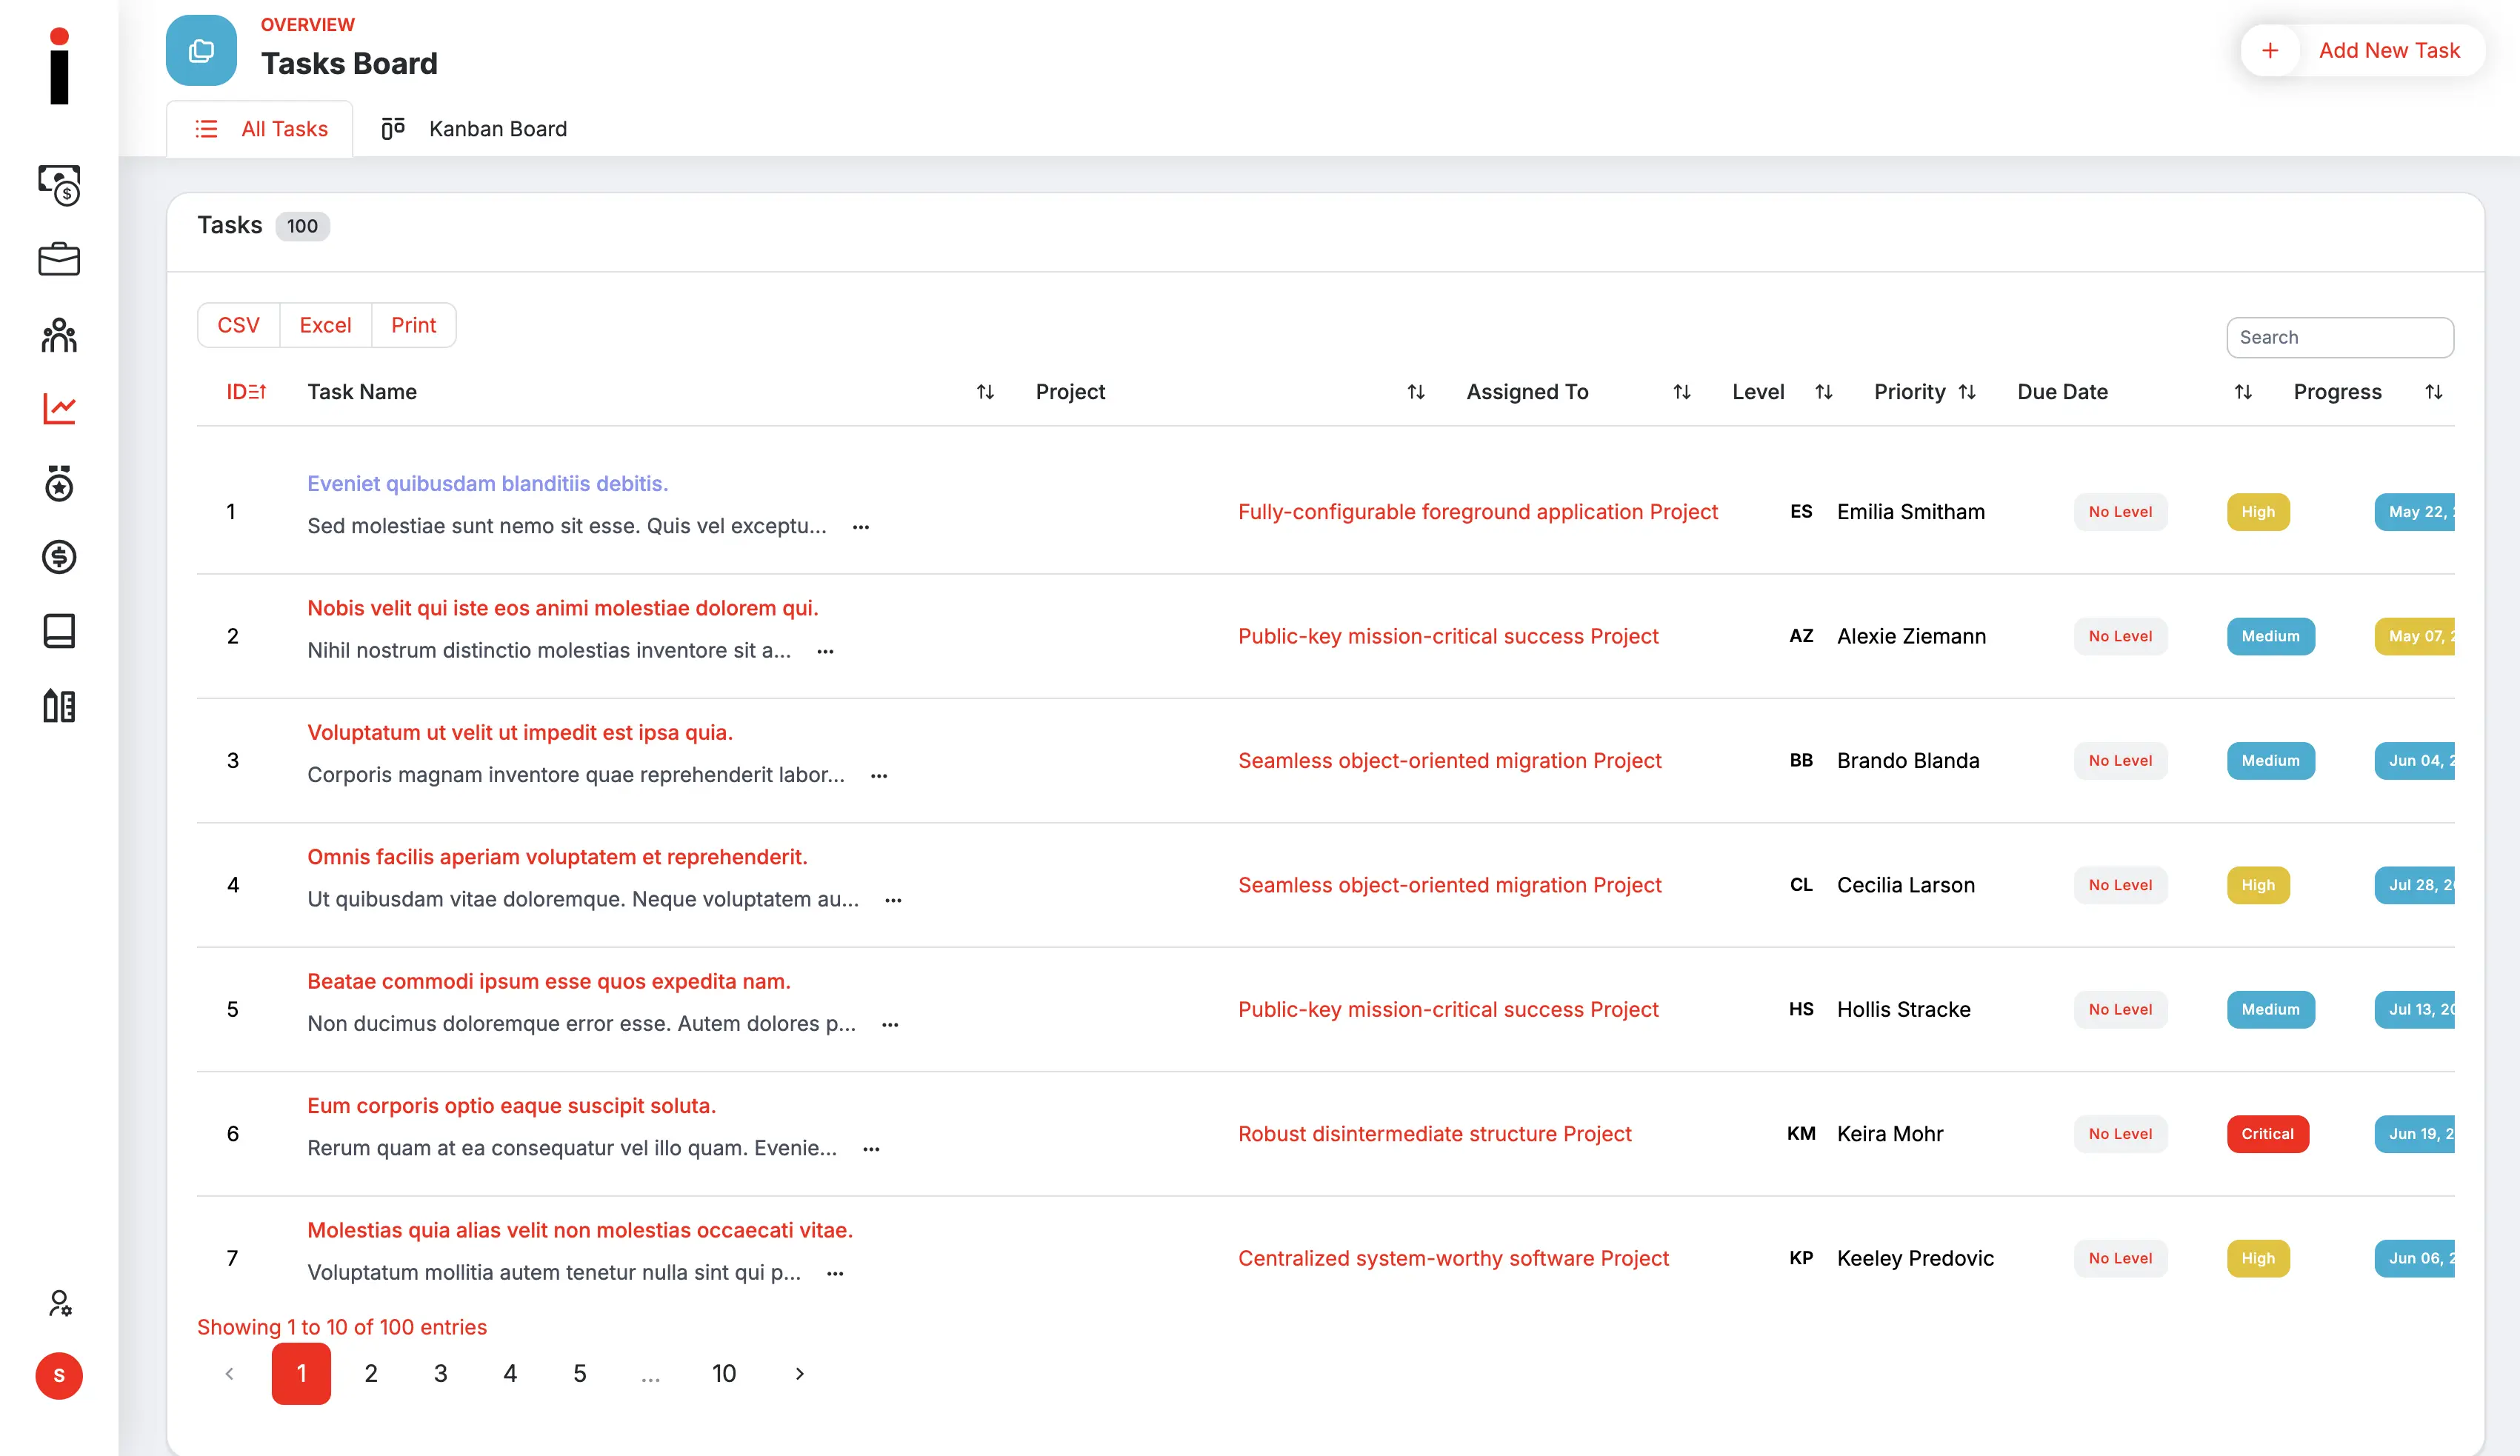
Task Board
The operational Kanban surface for the 100 active tasks — columns for To Do / In Progress / In Review / Done, drag-orderable cards, owner avatars, priority badges and SLA timers that flip red the moment a task sits past its due date.
- Kanban columns — To Do / In Progress / In Review / Done
- Drag-orderable cards with owner + priority + SLA
- Filter by project, owner, priority or due-date bucket
- Mirrored as a sortable table view per Task Manager preference
Jump to another chapter
Need a dashboard analysis like this?
If your team is paying for five SaaS tools that don't talk to each other, that's exactly the build we just shipped. Let's talk about consolidation.