Dashboard Analysis
The admin opens one screen and sees the whole platform: enrolments across online, in-class and blended; every feature entitlement in the matrix; the full course-request workflow; instructor management; and a courses summary rolling it all up. Every figure drills through to the module it came from.
Every section, explained.
6 working sections inside Dashboard Analysis — each one a screen we designed, built and tested in the live system.
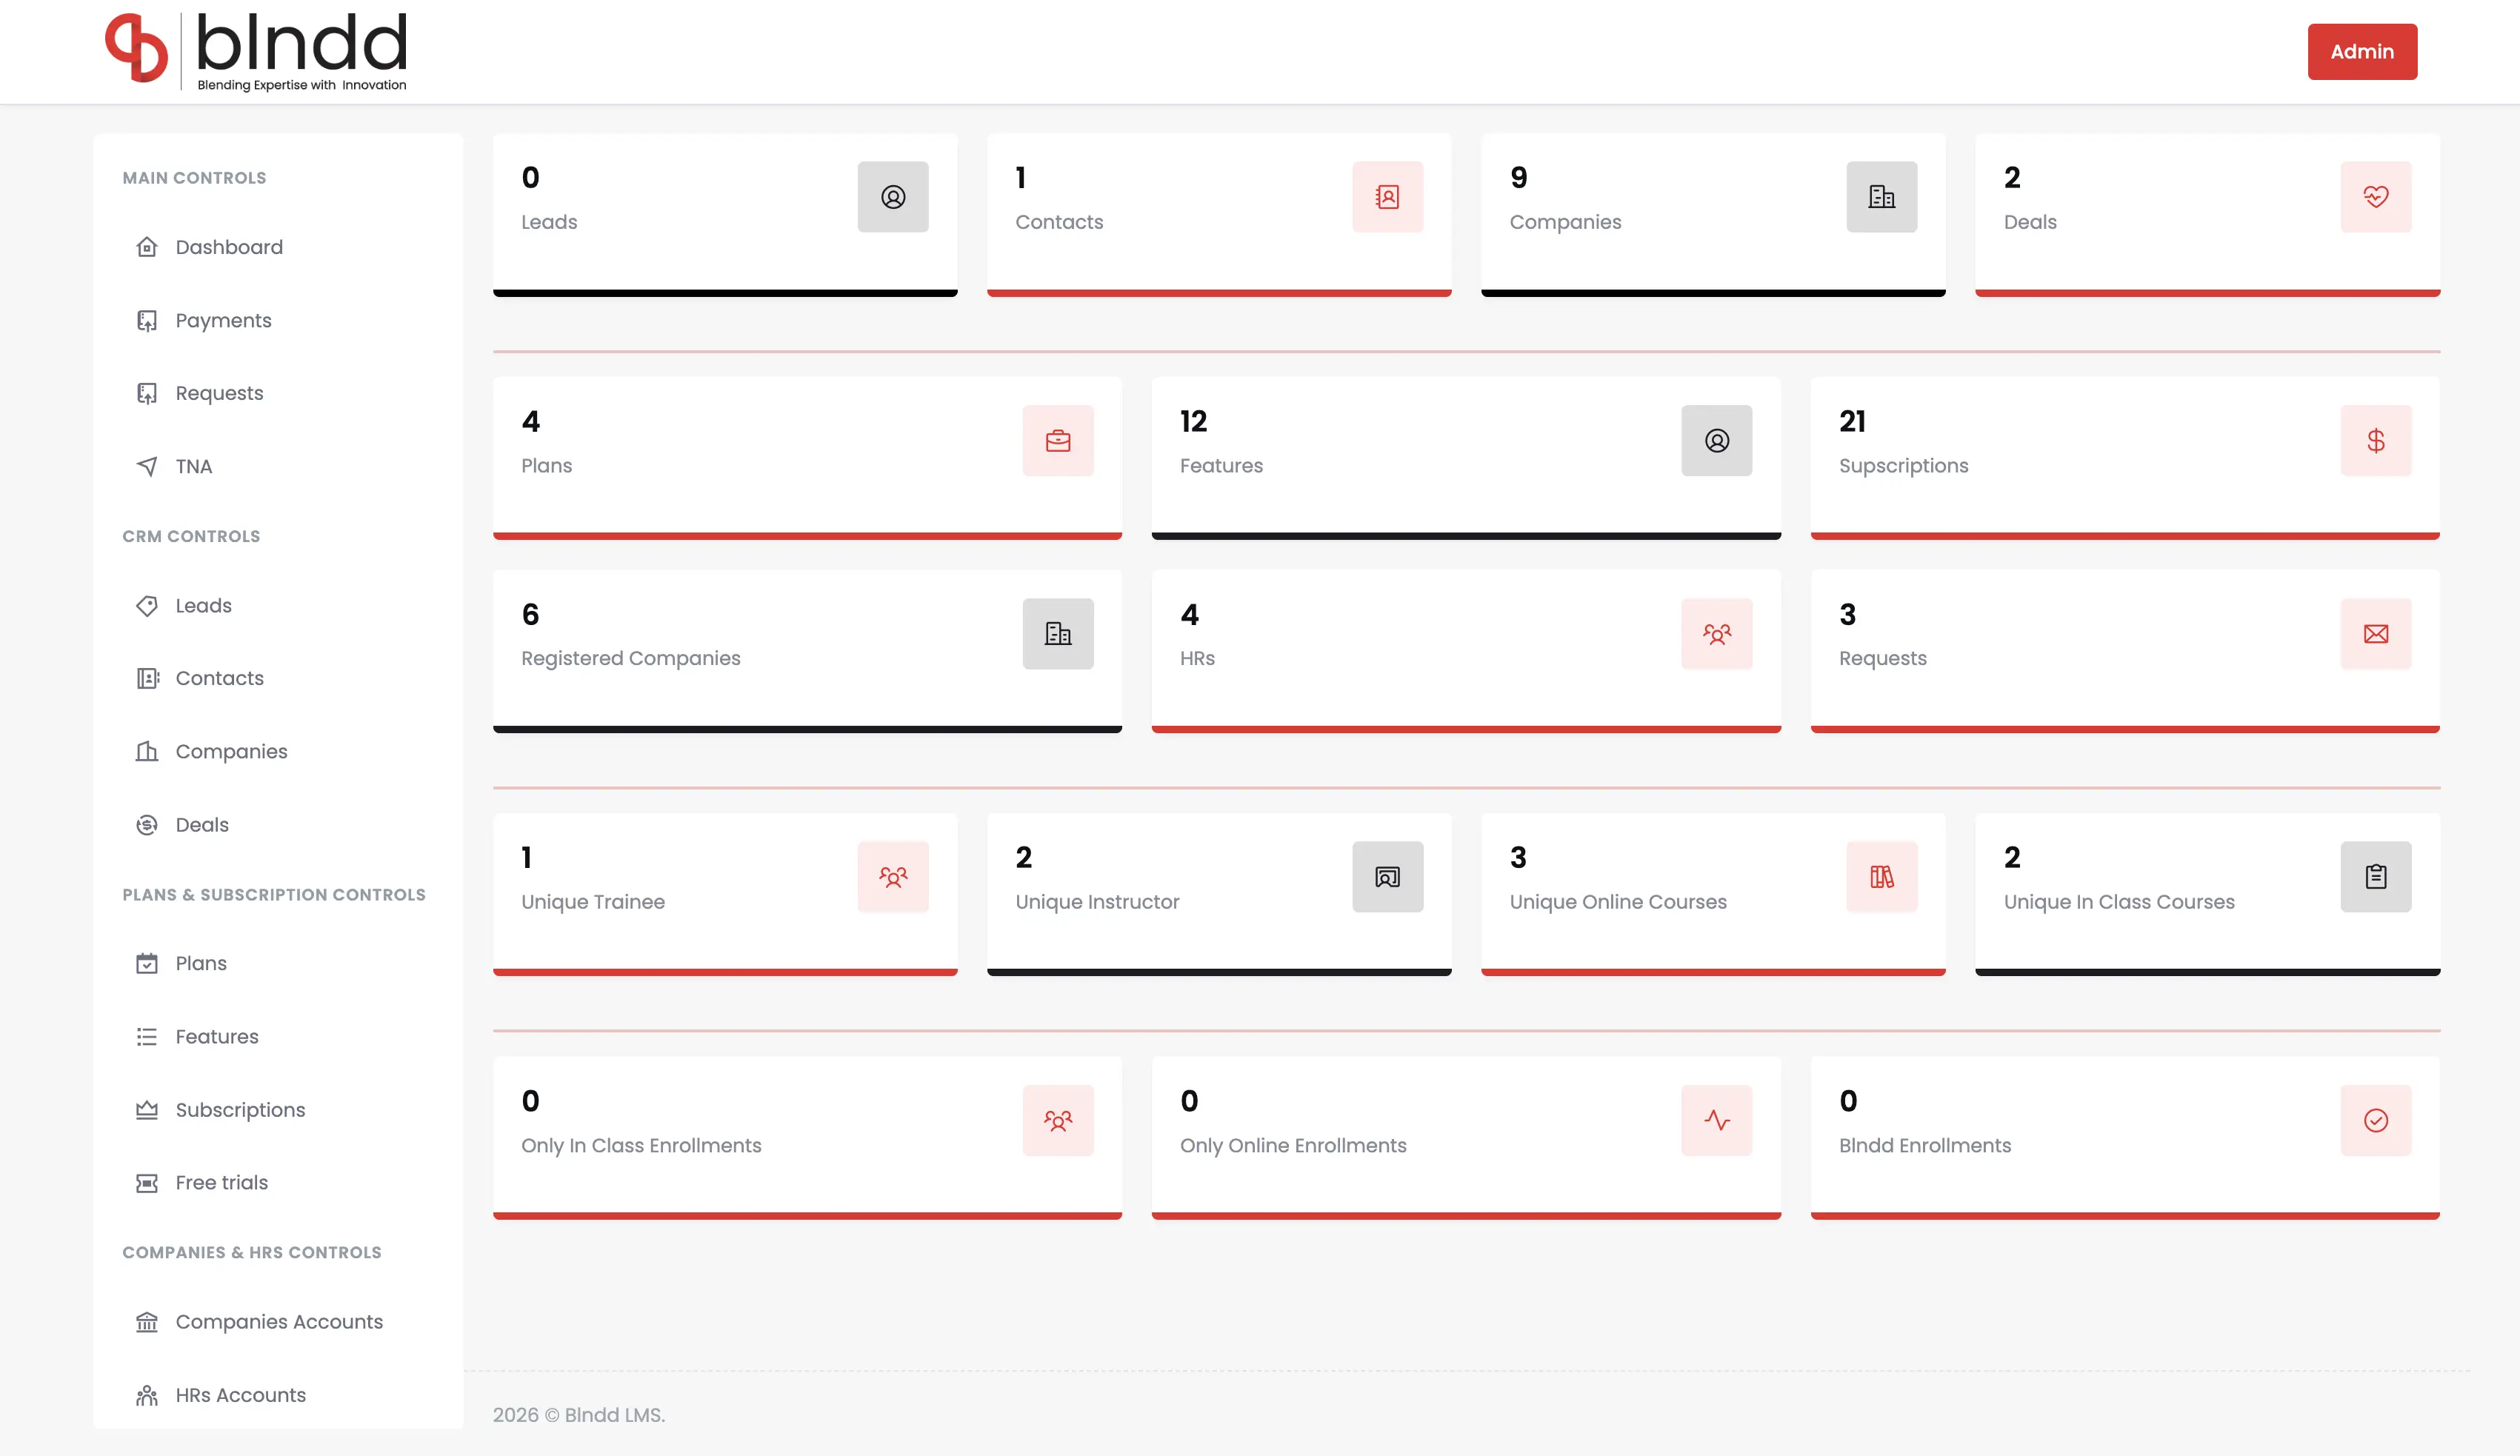
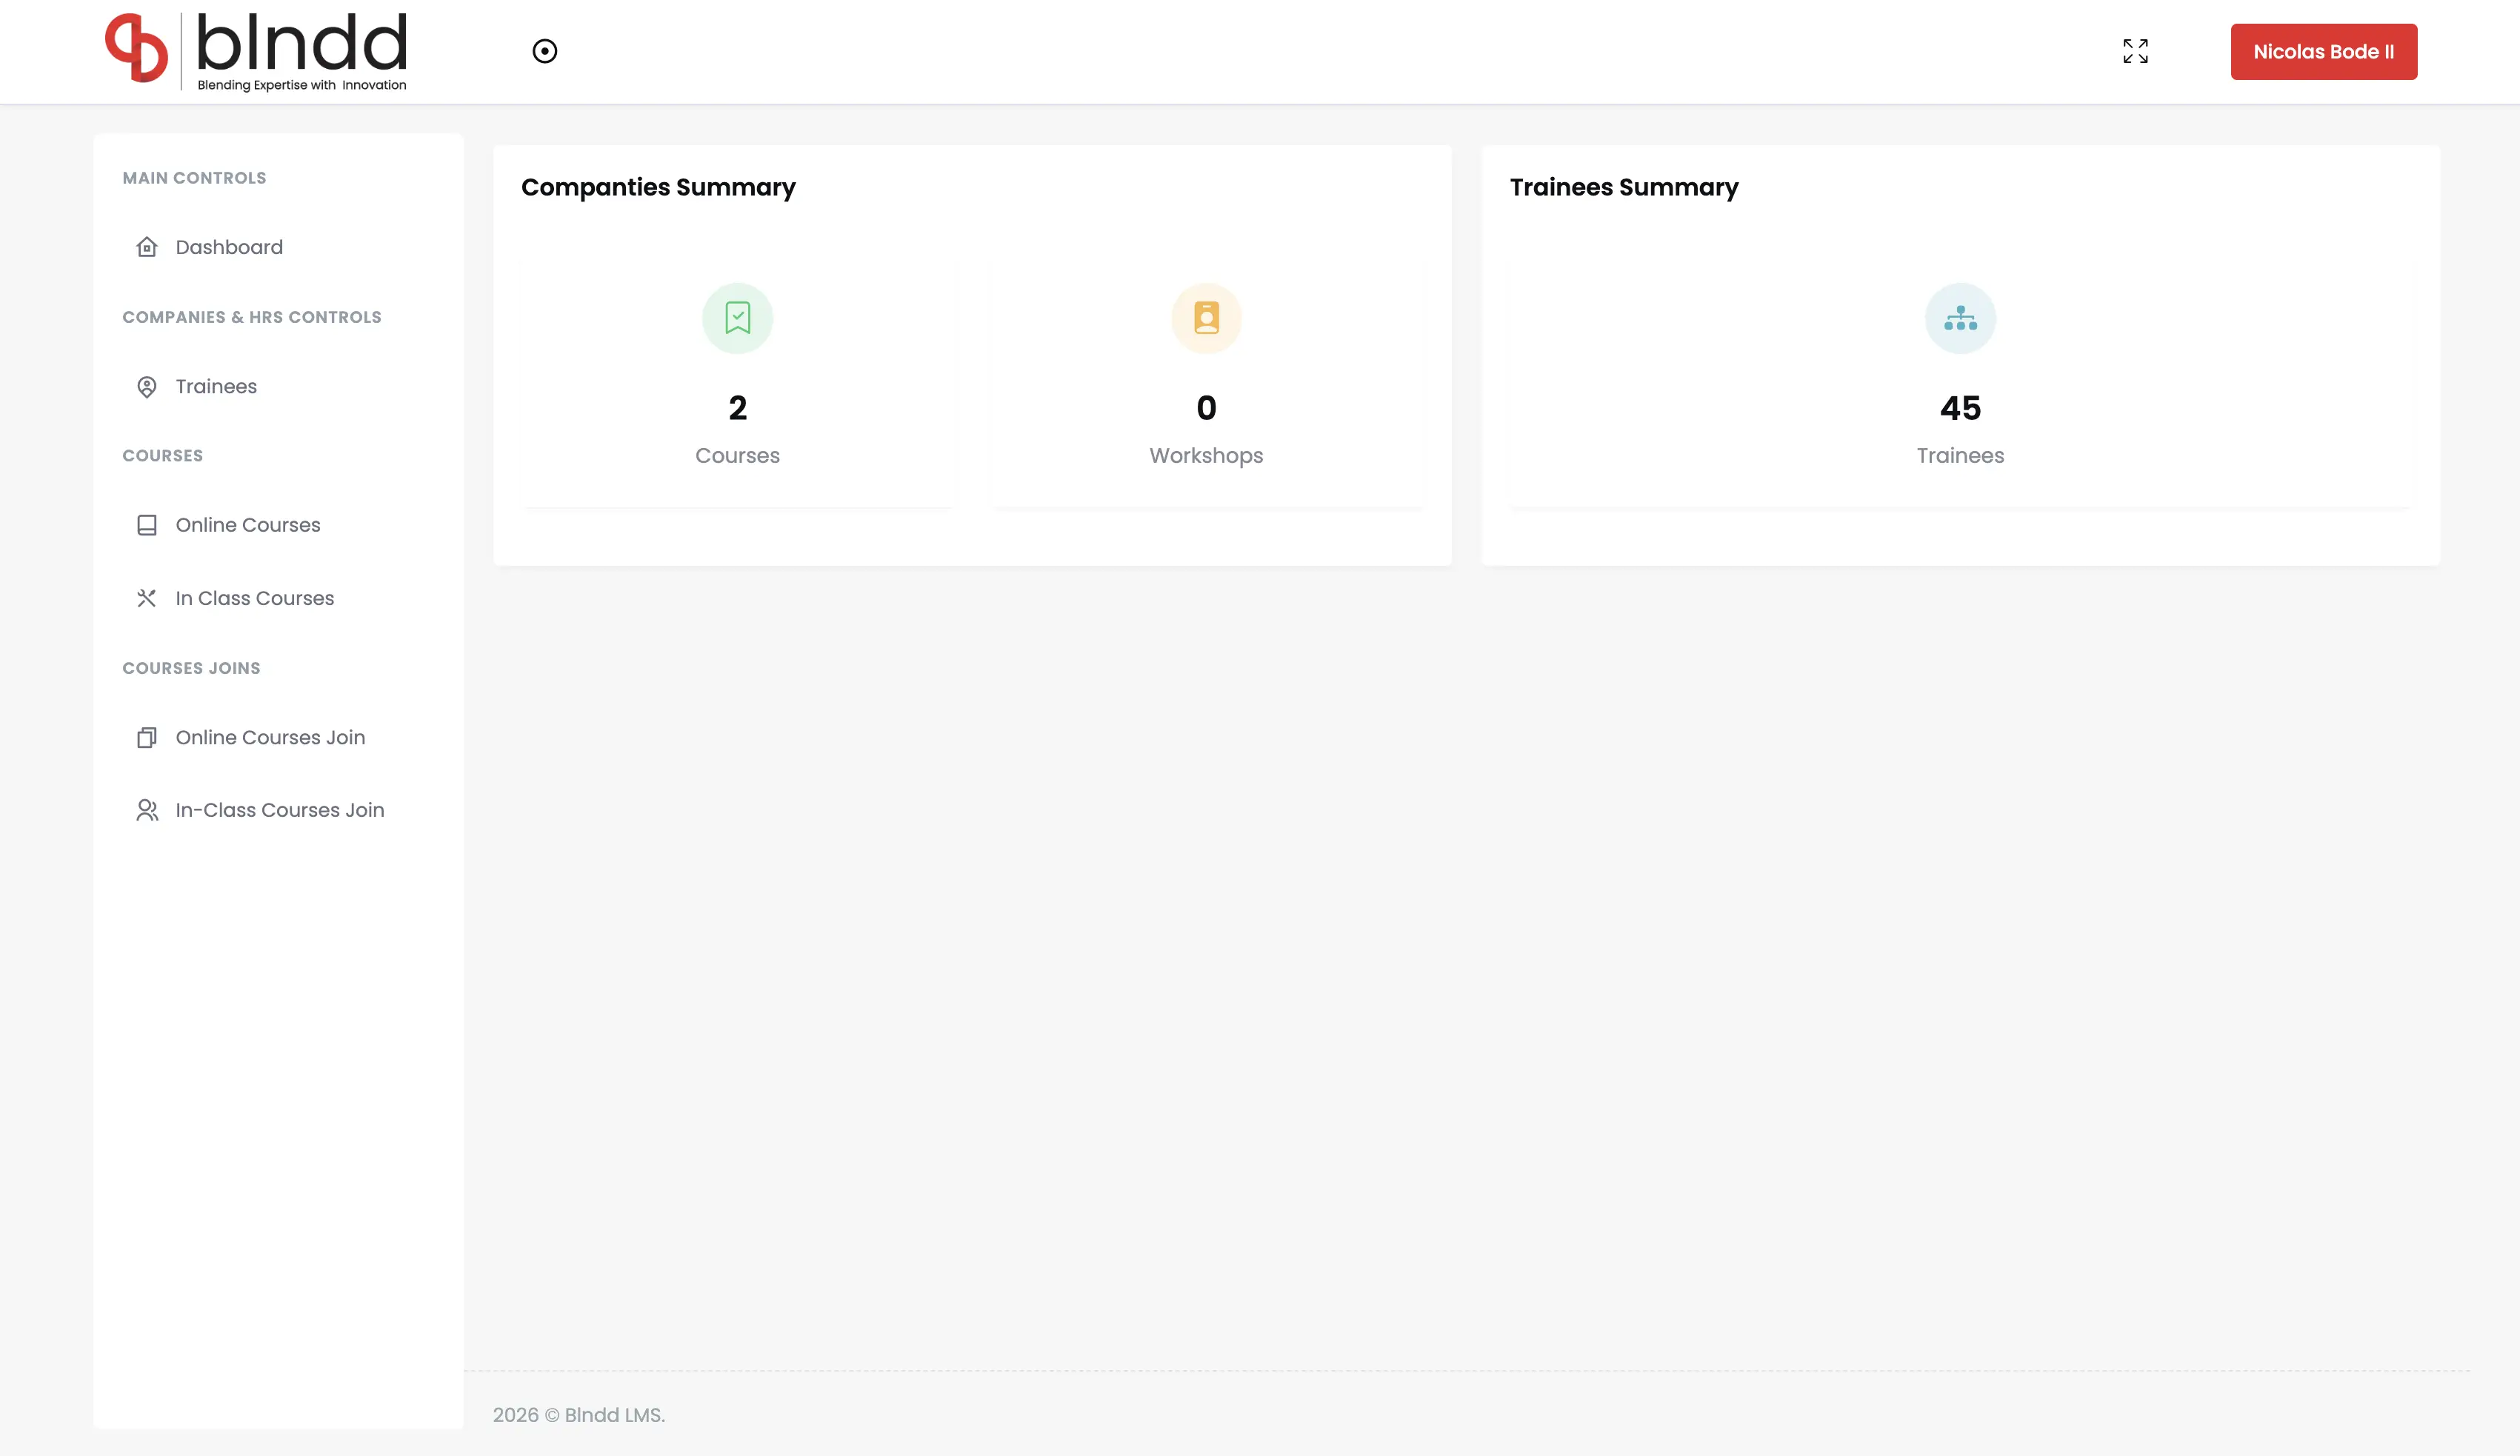
Admin Overview KPIs
The landing screen for every admin login — real-time KPIs across all 13 modules in a single view, dated dynamically, with quick-action shortcuts to the busiest tables and drill-through into each domain.
- 13+ first-class modules surfaced live
- Trainees + enrolments at the top of the screen
- Quick-action shortcuts to busy tables
- Drill-through into each module of origin
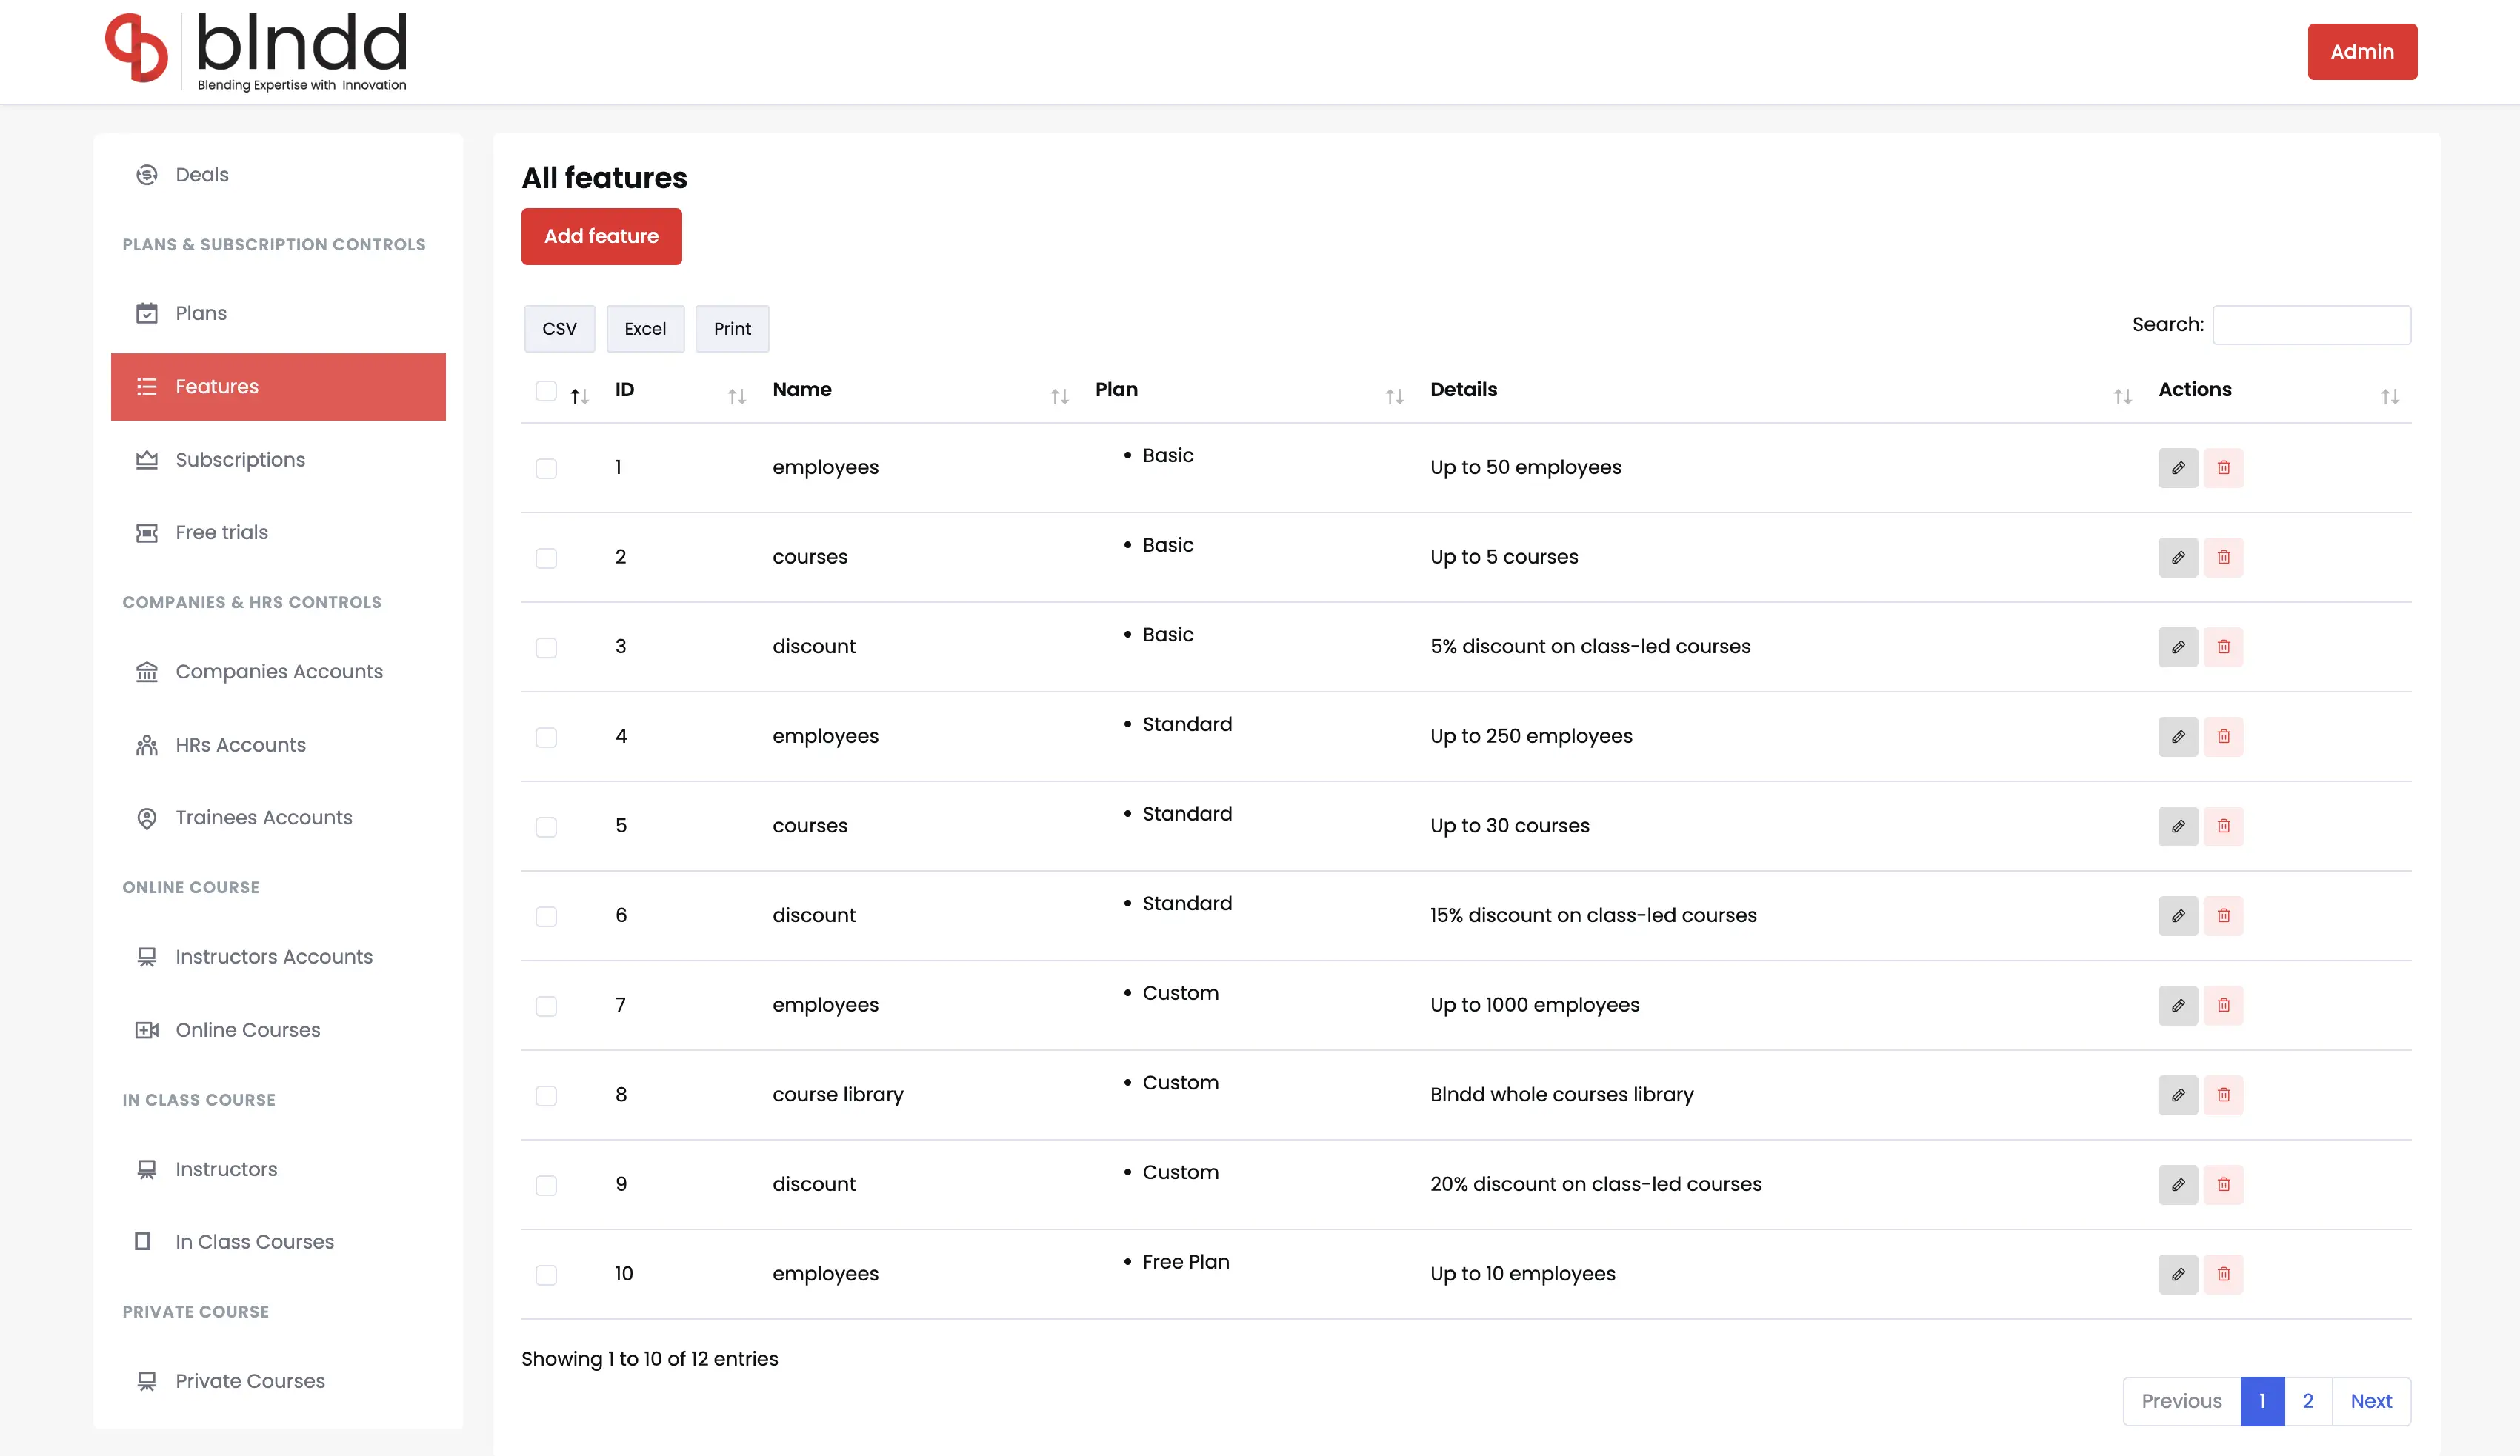
All Features Matrix
The entitlement layer — all 13 features that plans bind to, controlling seats, course access and discount rates — rendered as one matrix the admin tunes to drive entitlements platform-wide.
- 13 features as the entitlement source
- Controls seats, course access, discounts
- One config drives the whole platform
- Bound to plans in the subscription engine
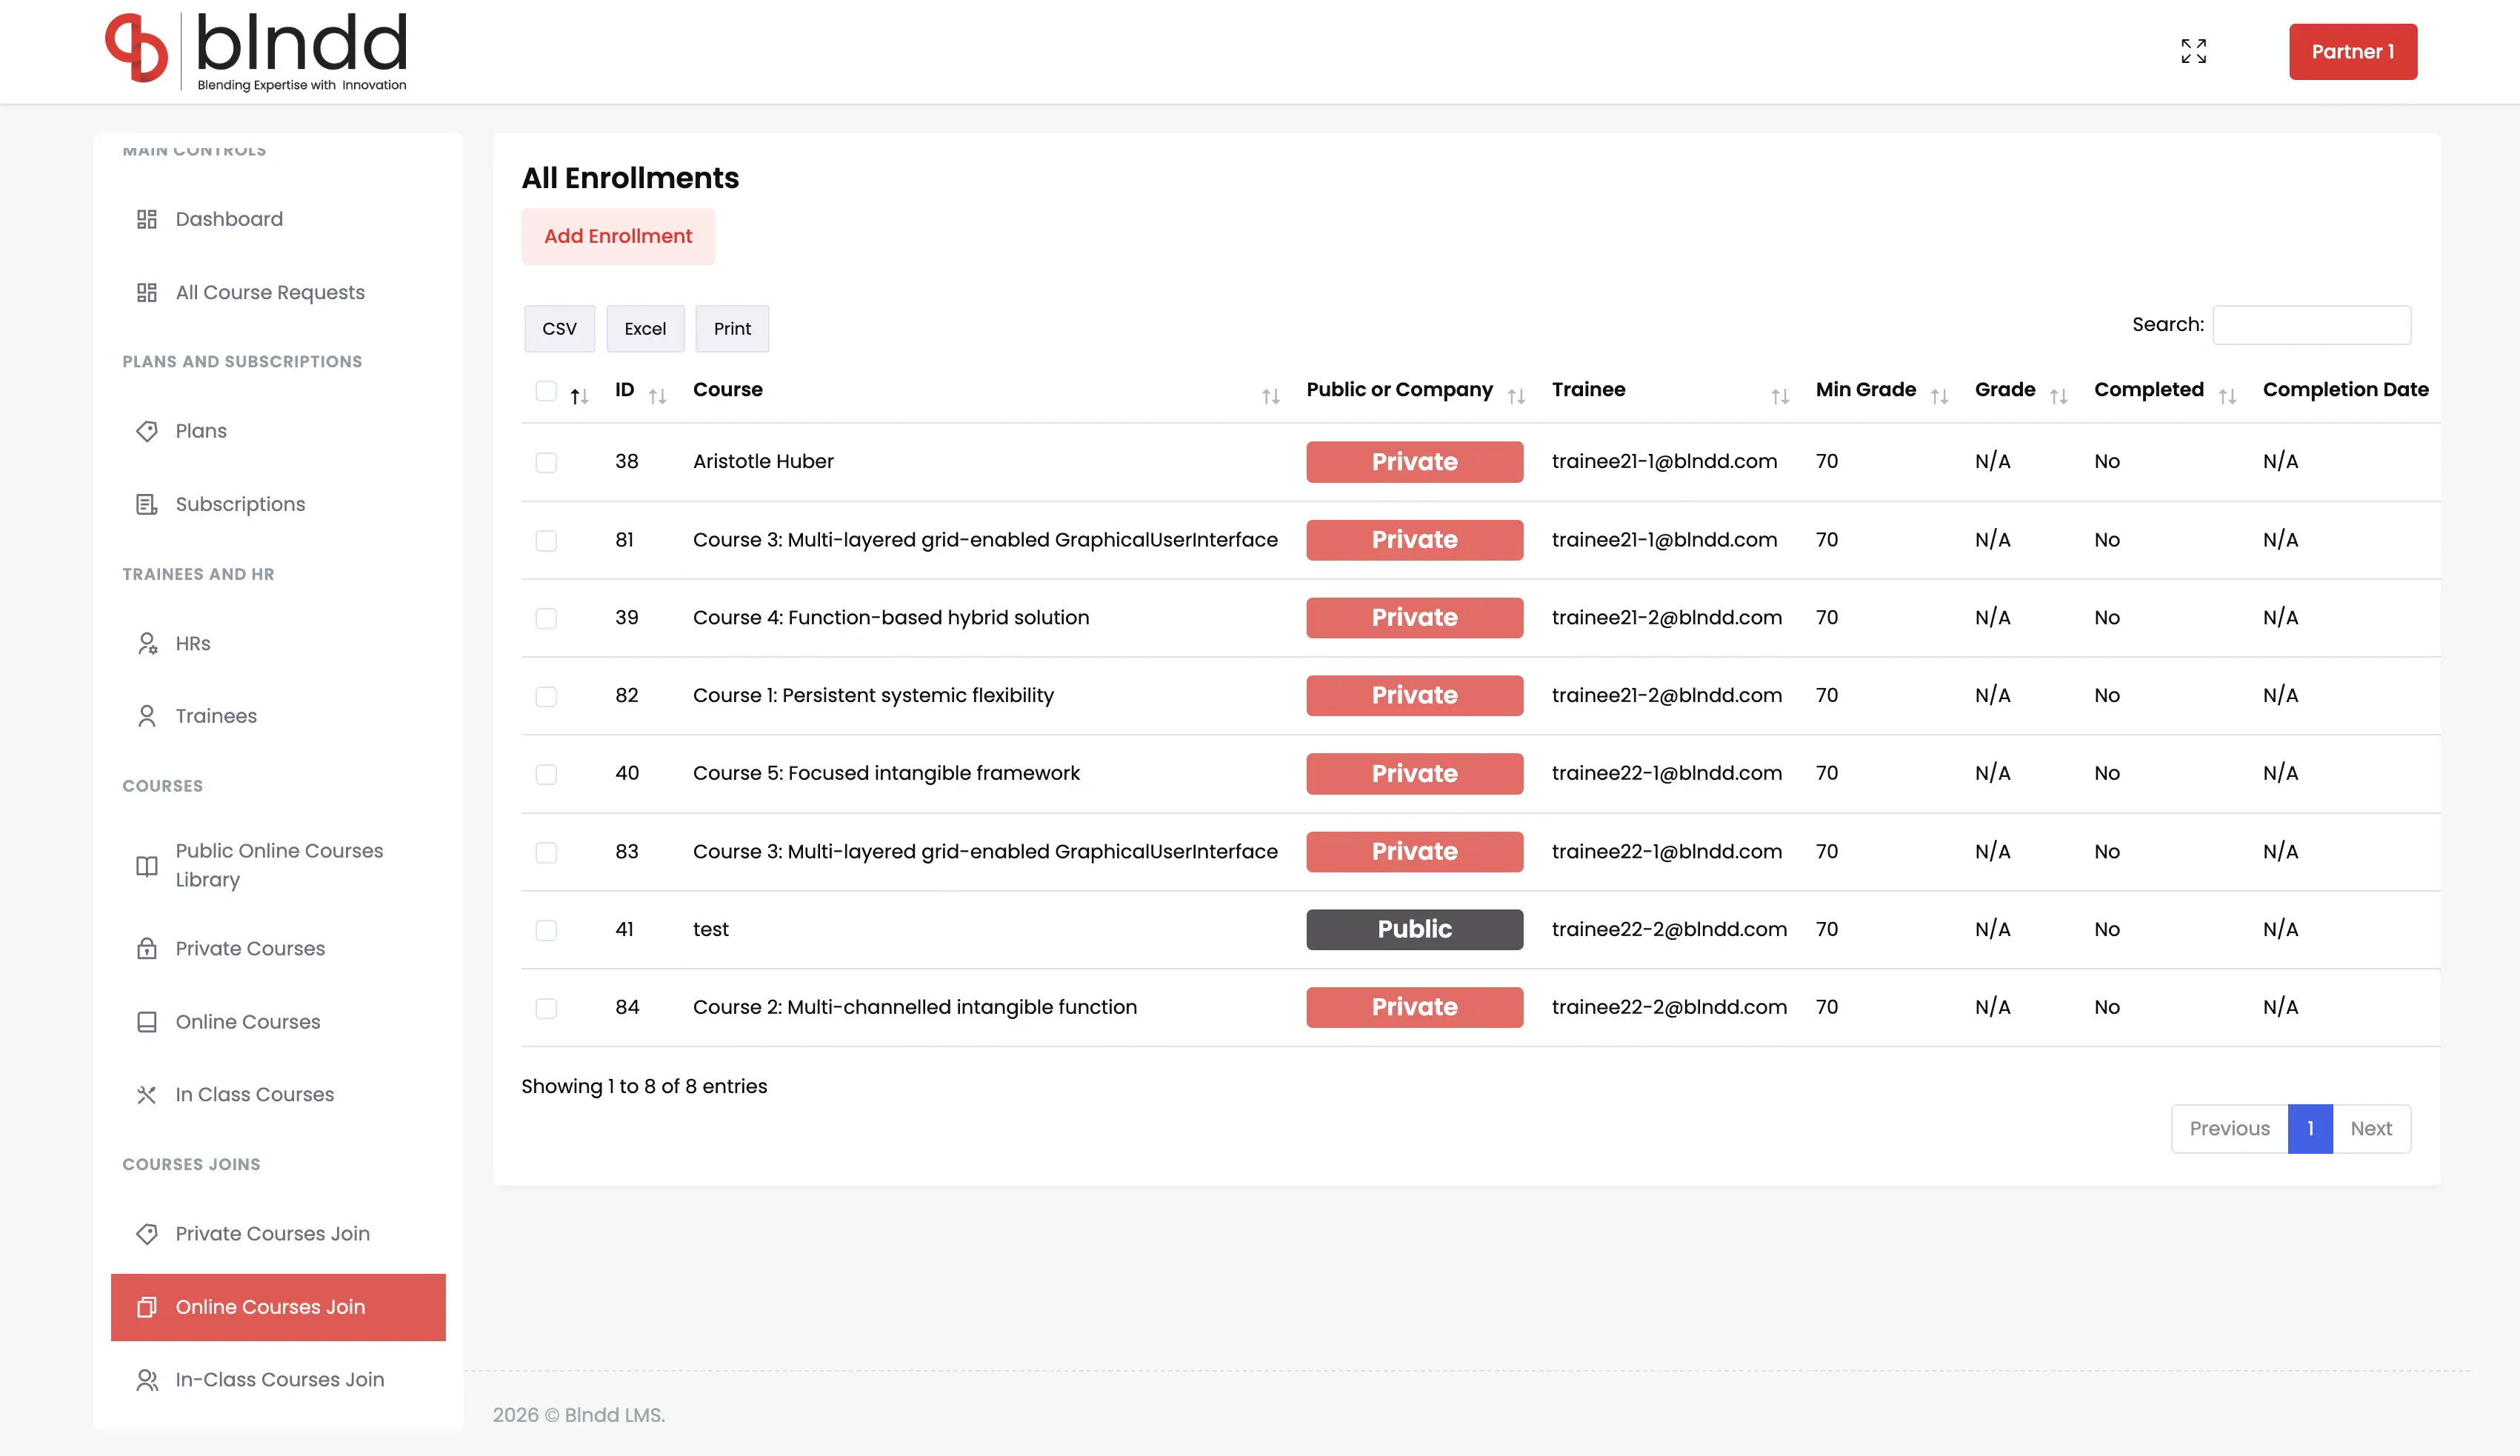
All Enrolments
Every enrolment across the three modes — 86 online, 12 in-class and 22 blended — in one filterable table, keyed to trainee, course and company, with status and progress per row.
- 86 online + 12 in-class + 22 blended enrolments
- Keyed to trainee, course and company
- Status and progress per row
- Filter by mode, company or course
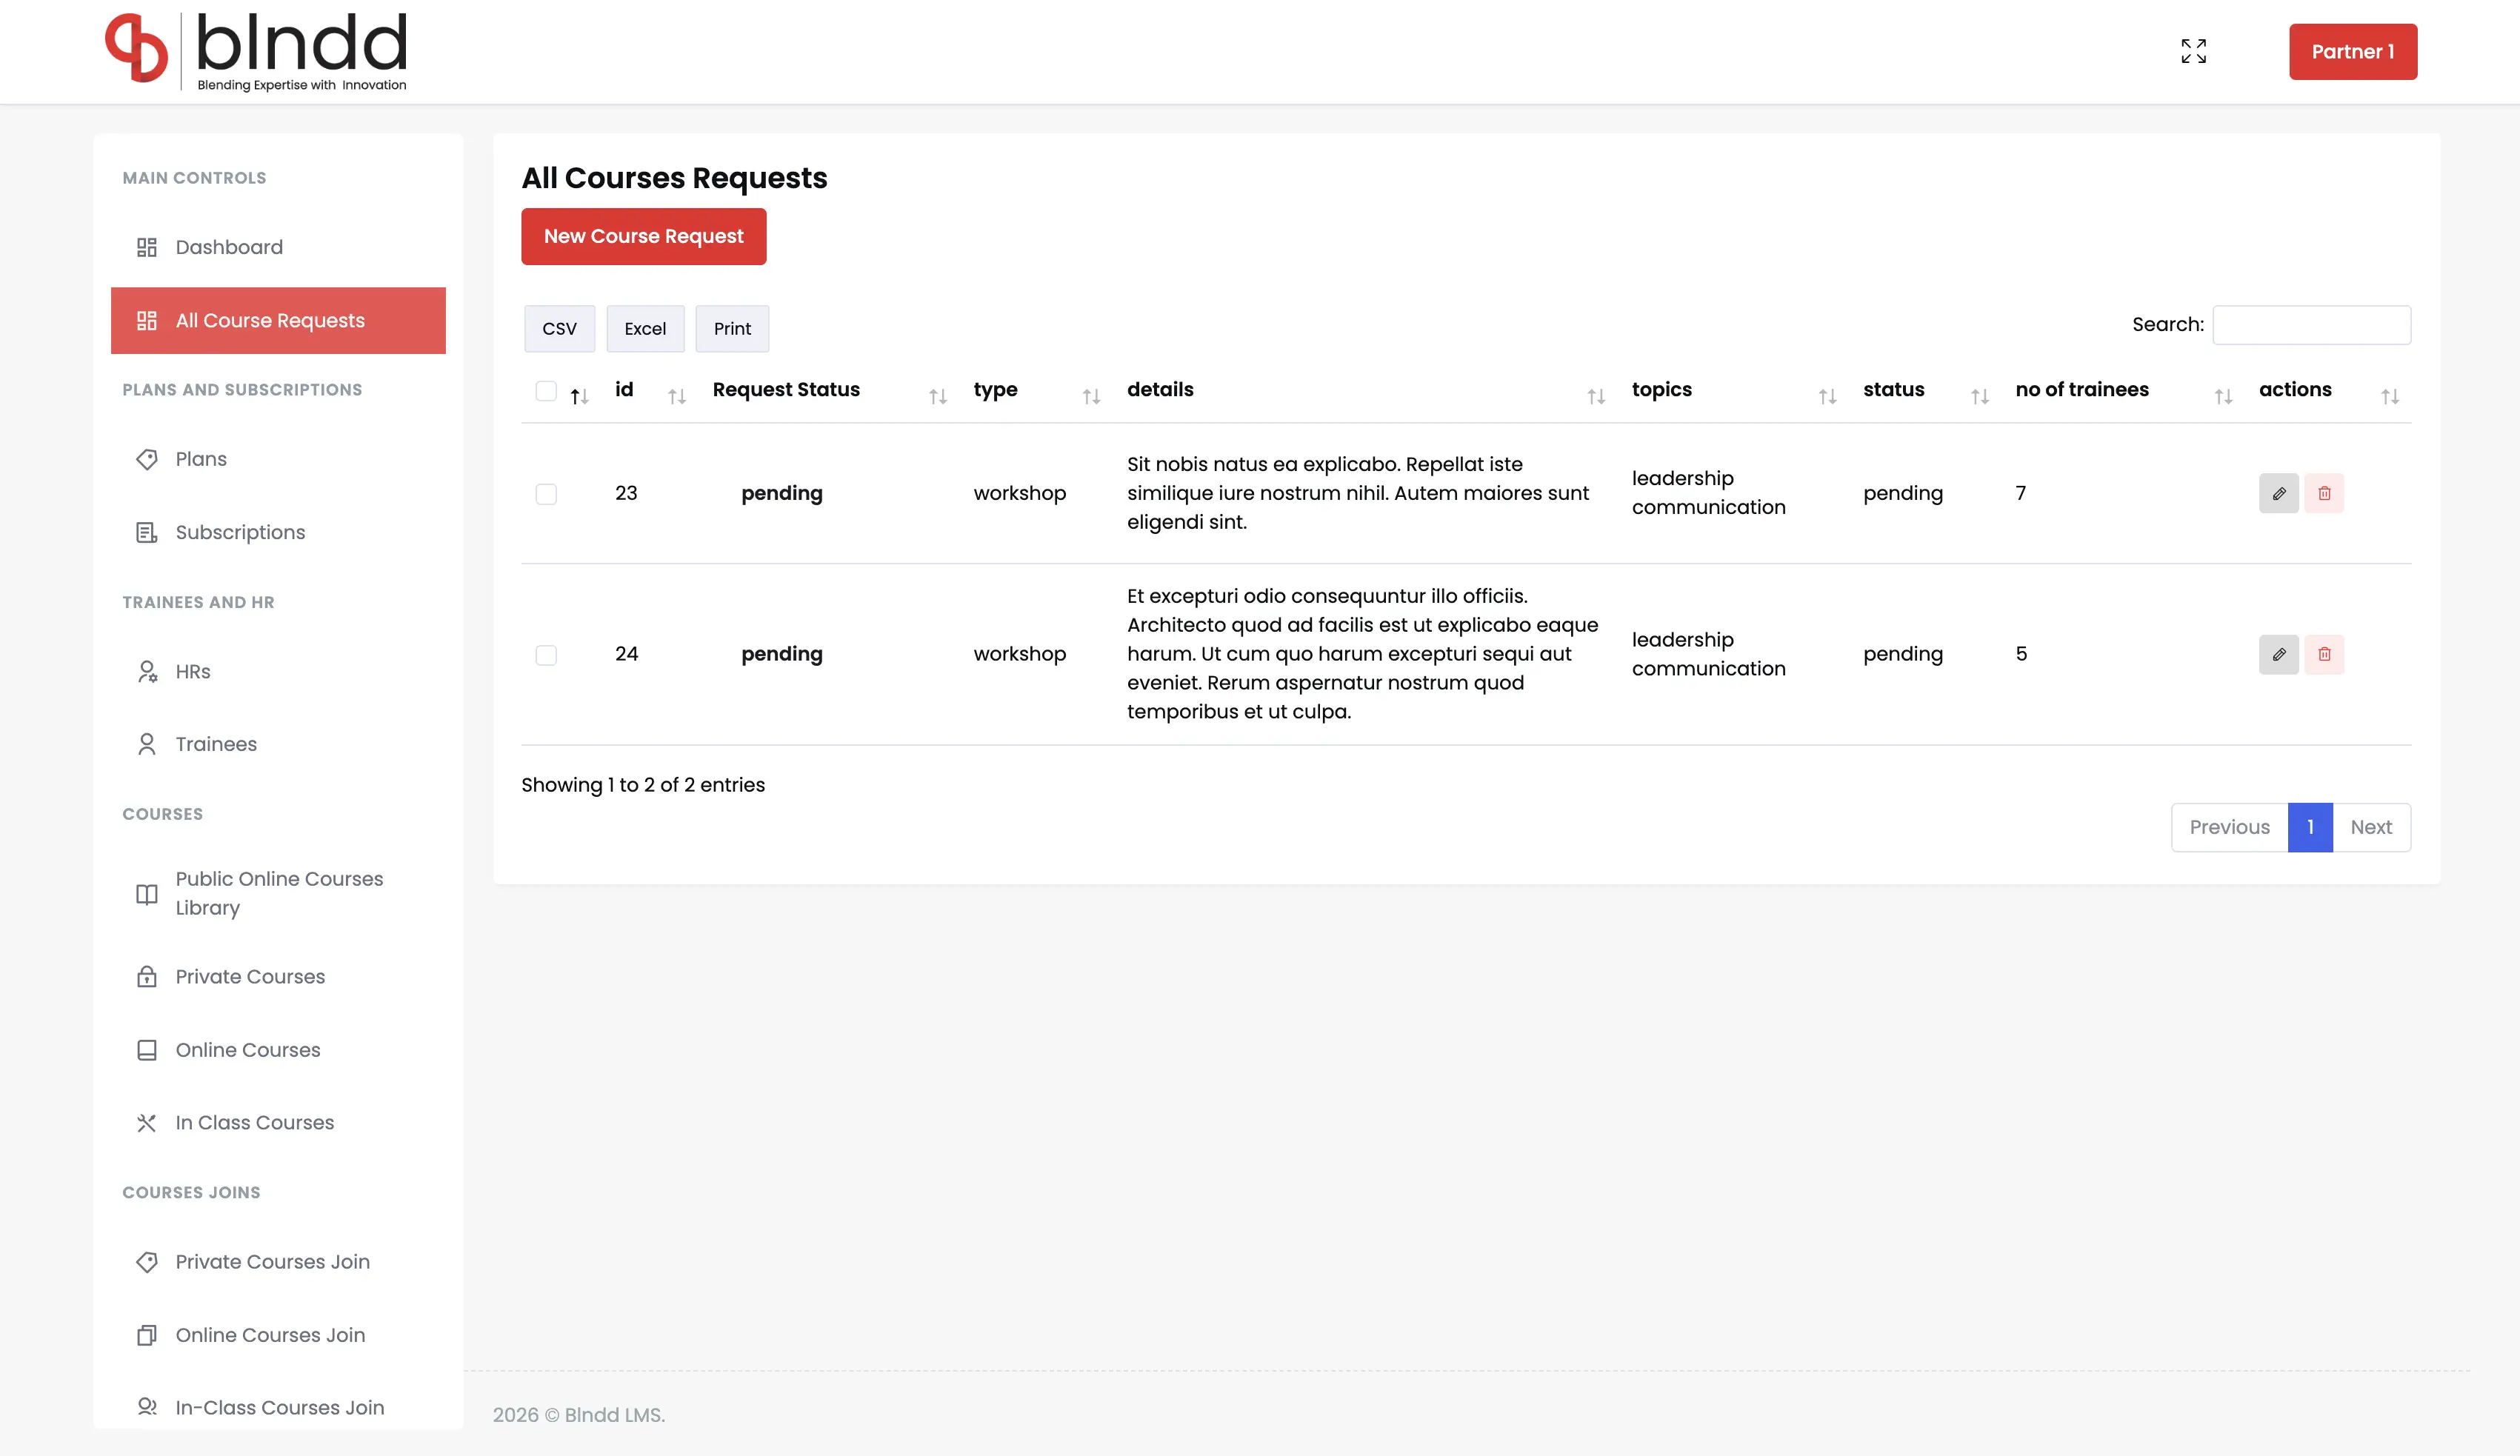
All Course Requests
The 25 training requests captured from HR managers across the 9 companies — categorised by course type, topic and trainee count — with submit / approve / reject directly from the dashboard and a full audit trail.
- 25 training requests captured
- Categorised by type, topic, trainee count
- Submit / Approve / Reject with audit trail
- HR-initiated, admin-resolved
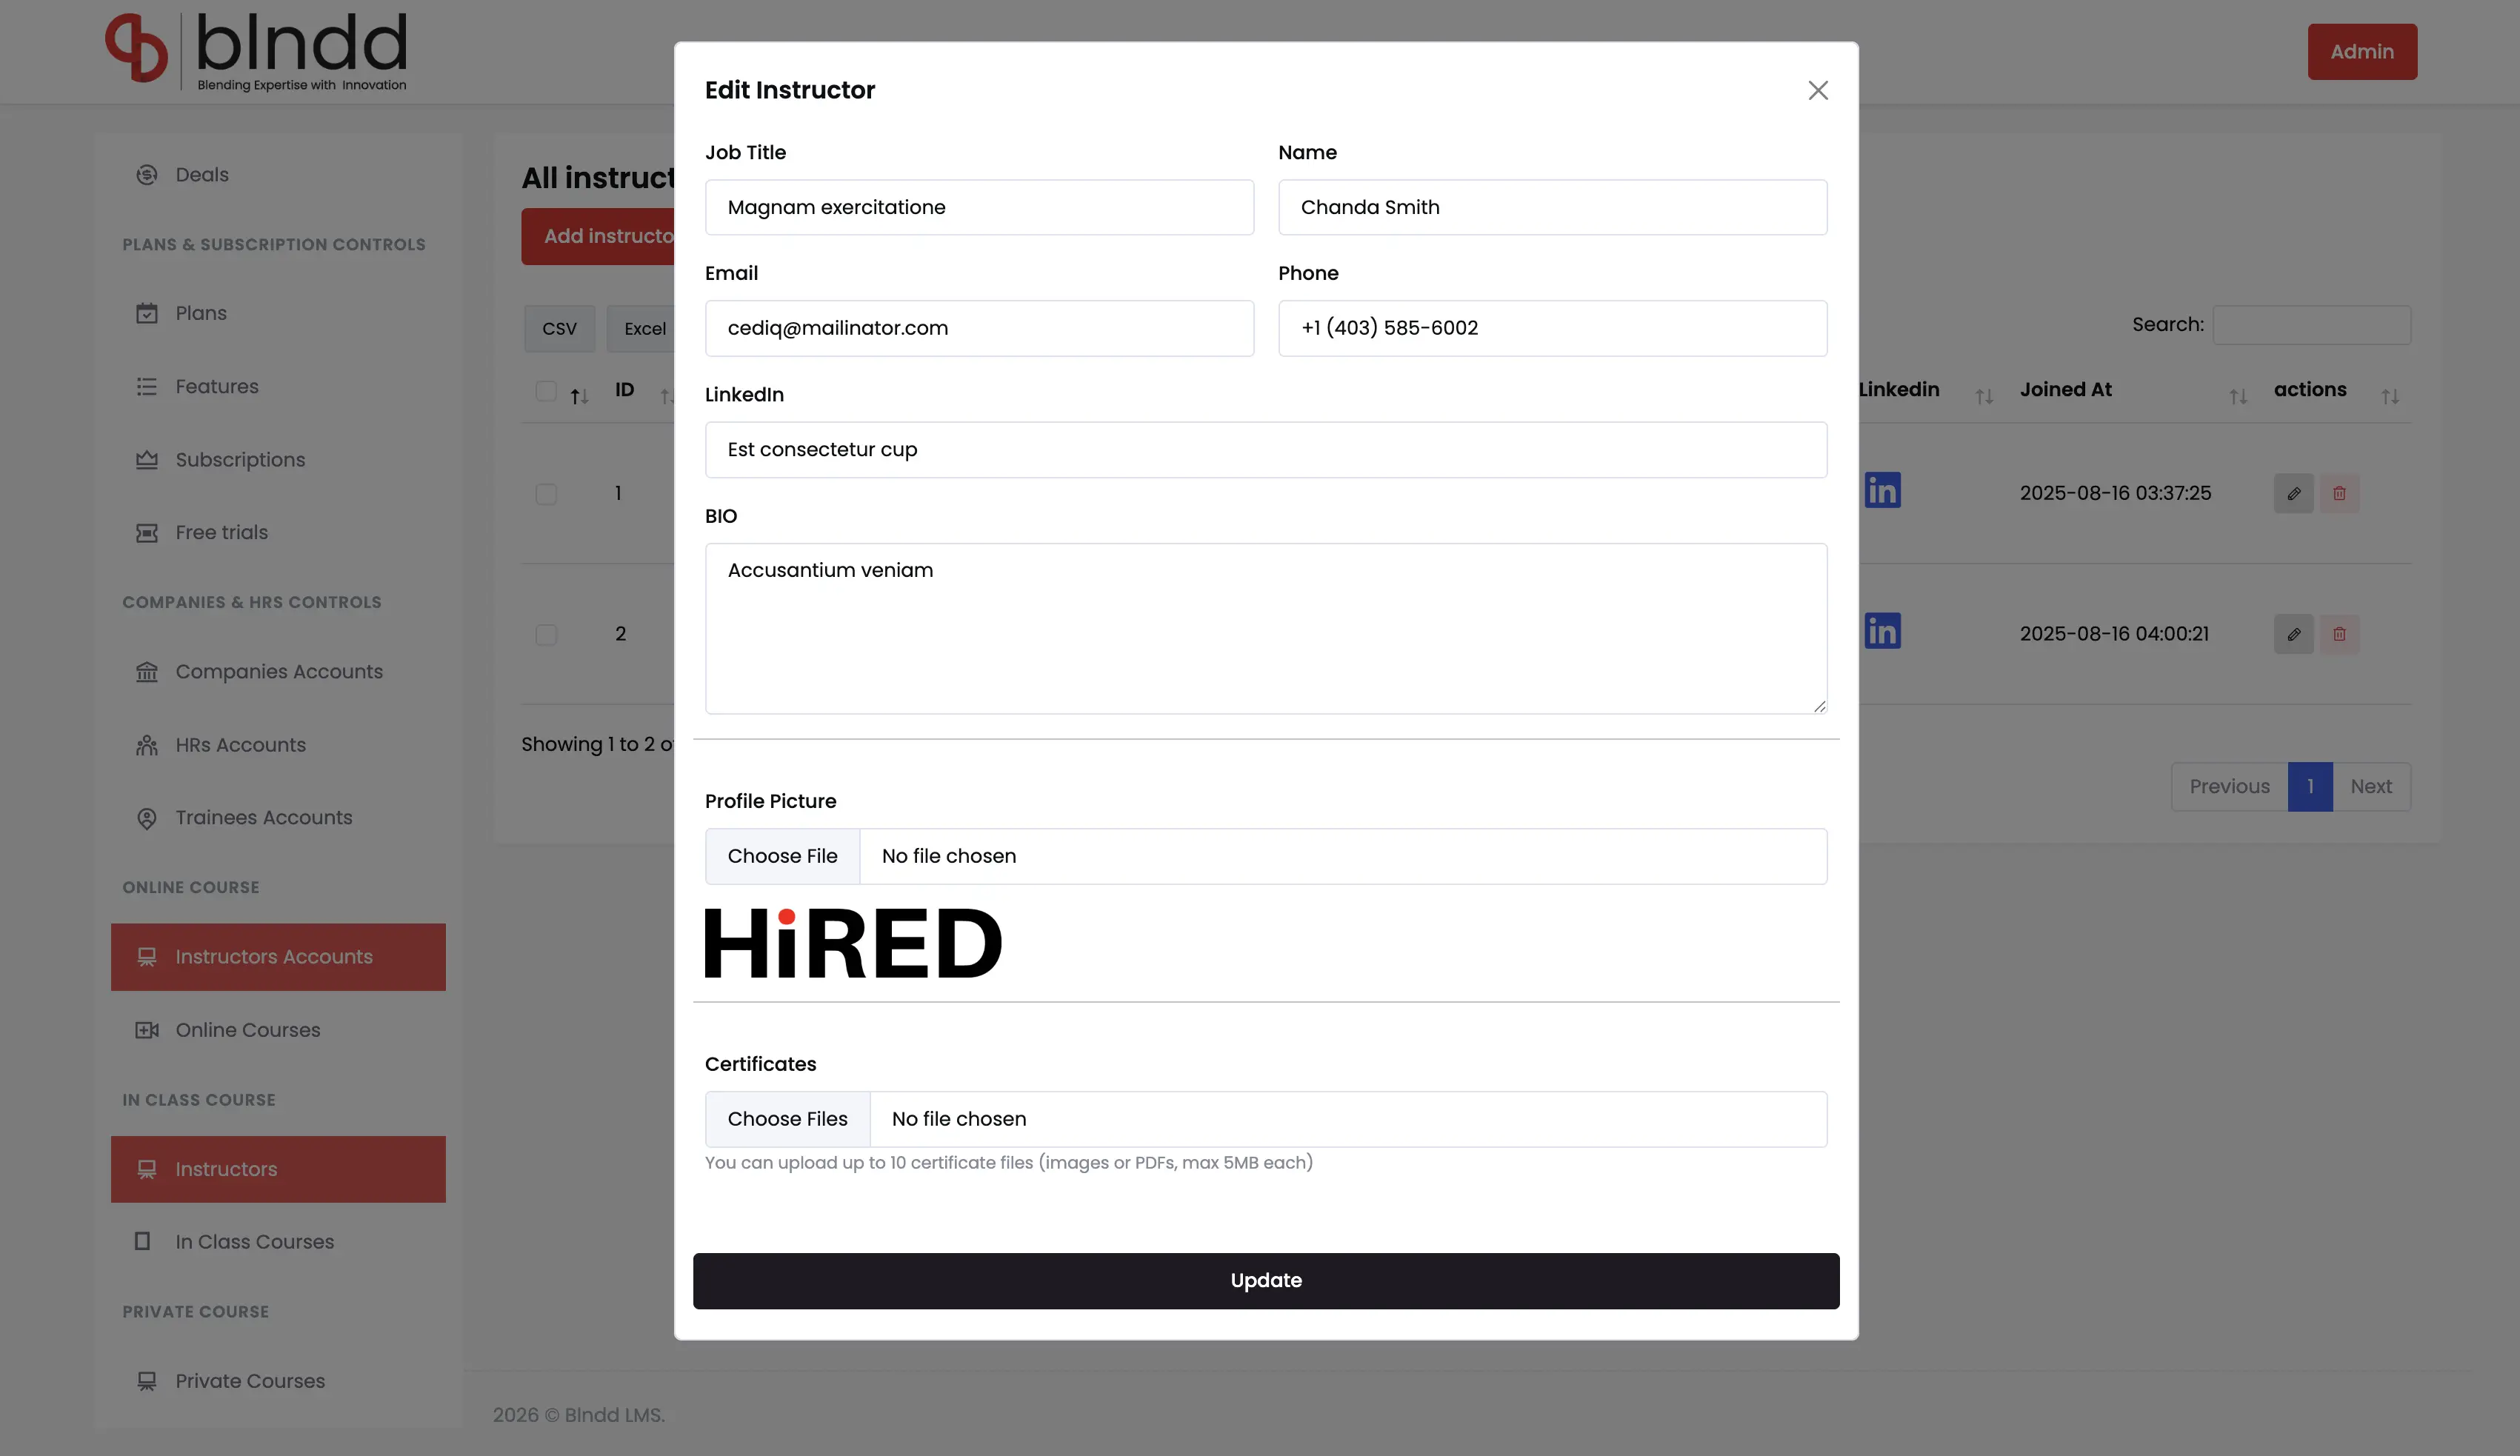
Instructor Management
Managing the 5 certified instructors — profile, contact, LinkedIn and topic-area mapping — with the same record powering both course assignment and the public Instructors page on blndd.net.
- 5 instructors with profile + LinkedIn
- Topic-mapped across the five areas
- Assigned to online + in-class + private courses
- Same record drives the public showcase
Courses Summary
The roll-up across the whole catalogue — 13 online courses, 6 in-class workshops, ~242 total hours — with per-course performance and topic-area distribution for leadership reporting.
- 13 online + 6 in-class courses tracked
- ~242 total course hours
- Per-course performance roll-up
- Topic-area distribution for reporting
Jump to another chapter
Need a dashboard analysis like this?
If your team is running training on spreadsheets, instructor calendars and a dozen vendor portals, that's exactly the build we just shipped. Let's talk about consolidation.