





Admin Dashboard
A ten-module operating system grouped under Users, CRM, Plans & Subscriptions, Finance and General Management. Every screen is bilingual EN/AR, every list supports CSV / Excel / Print export, and every cash event reconciles into a single P&L report. Credit-based usage flows from chat metering through subscriptions to payments, and every public-site lead lands directly in the CRM.
Every section, explained.
5 working sections inside Admin Dashboard — each one a screen we designed, built and tested in the live system.
Analytics Dashboard
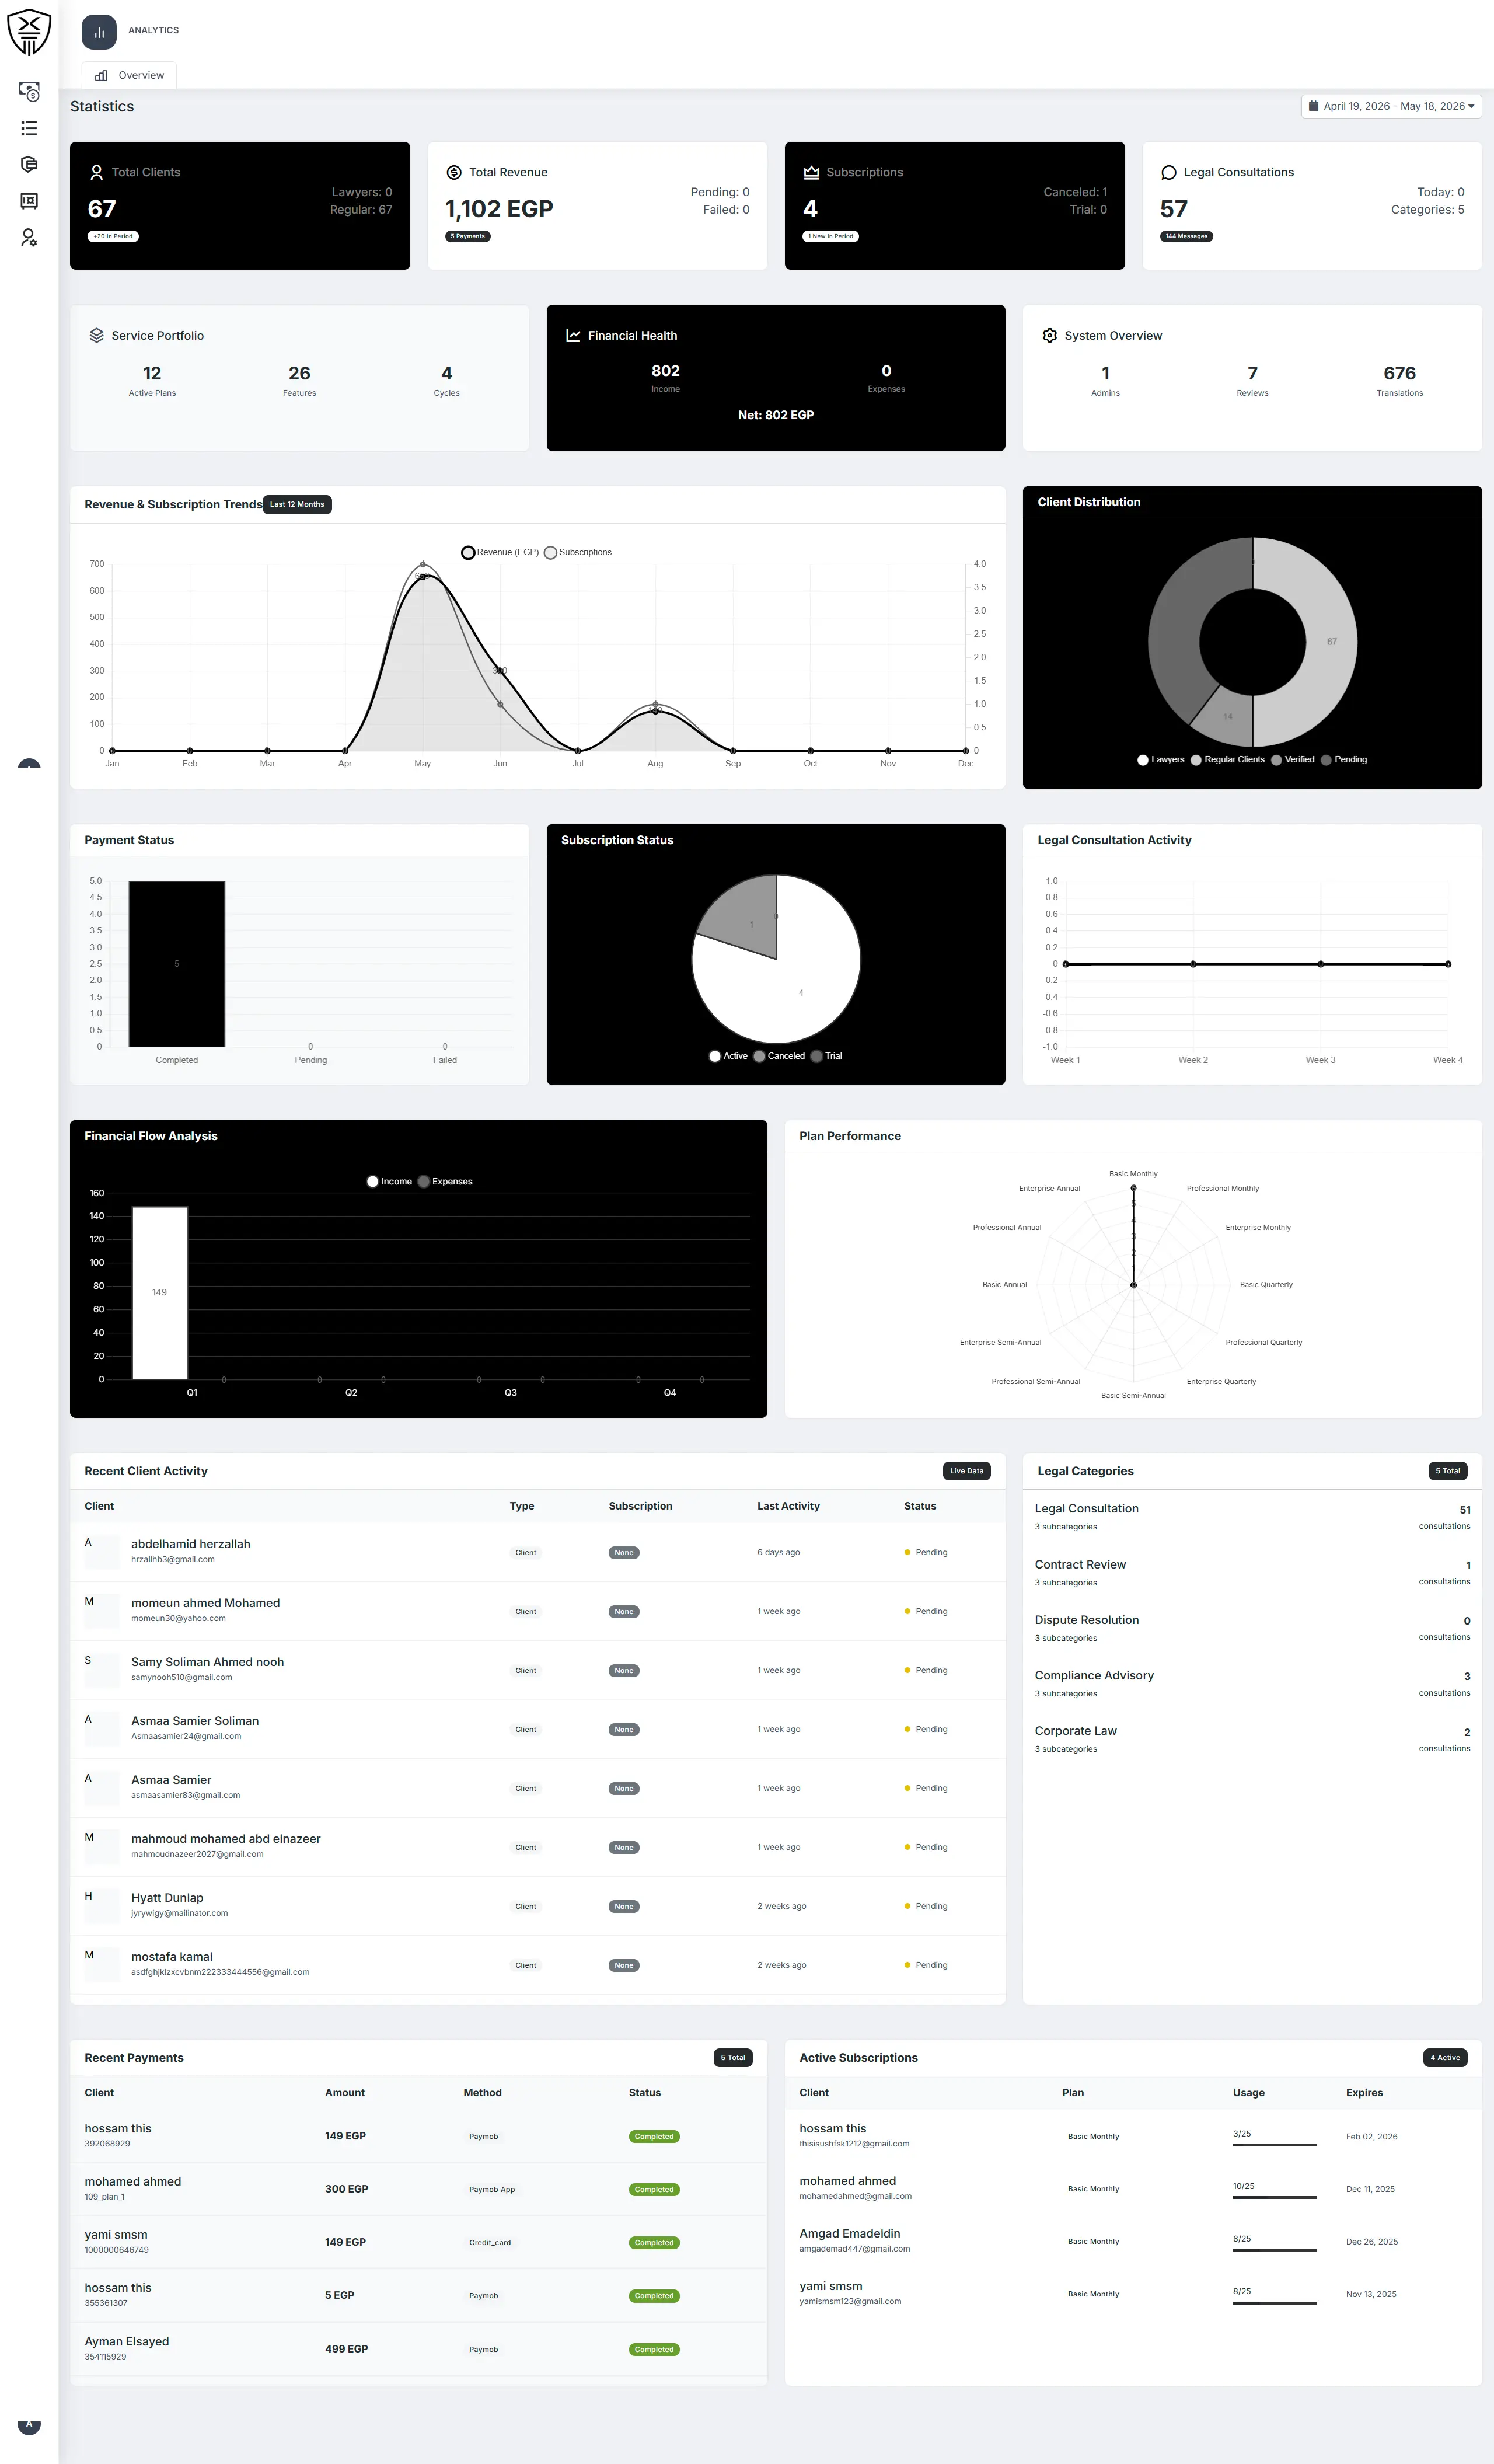
The landing page acts as a real-time control center. KPIs and charts span business health, customer health and AI usage — all driven by a single date-range filter (Today / 7 / 30 days / This or Last Month / This Year / Custom).
- Total Clients (57) split into Lawyers vs. Regular users
- Total Revenue 1,102 EGP from 5 payments — pending / failed tracked
- Subscriptions (4 active, 1 canceled) + Consultations (57 / 144 messages)
- Charts: Revenue, Client distribution, Plan performance, Financial flow
Users Management
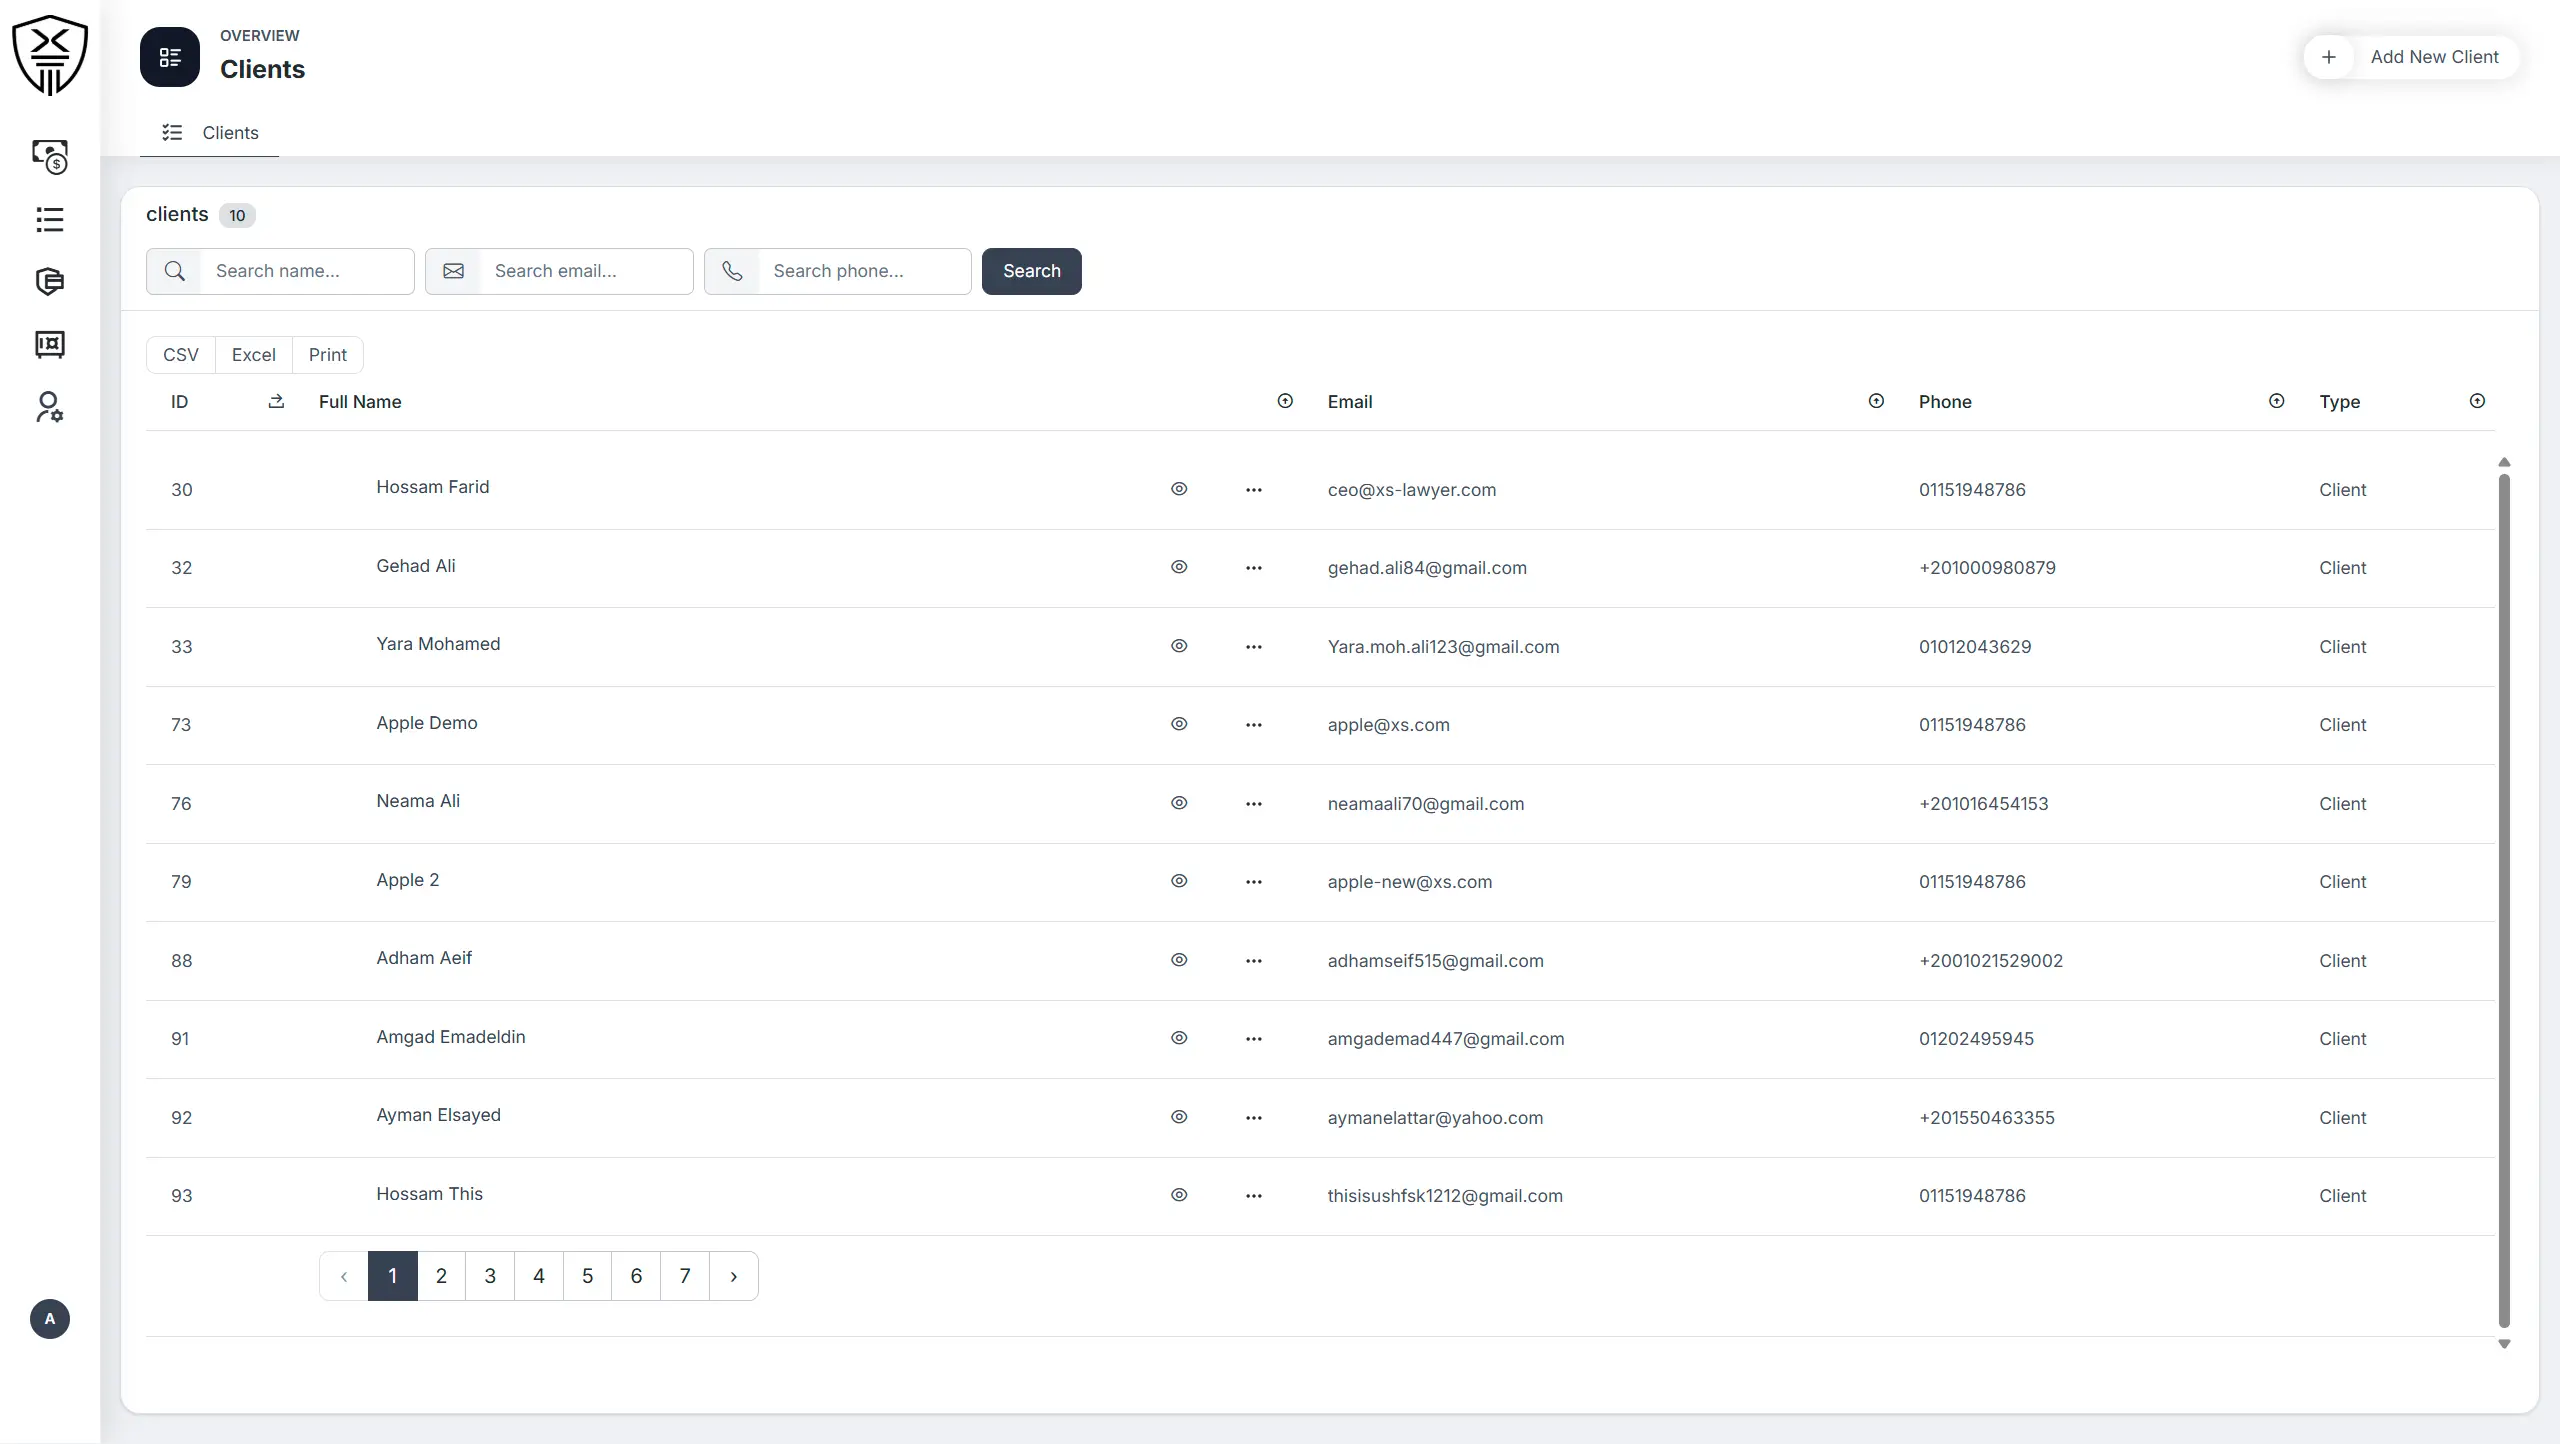
The end-user surface. Clients (57 total) tracked with type Client / Lawyer, registration date, plan tier and subscription status — with full CSV / Excel / Print exports, search across name, email and phone, and an Add New flow that ties new accounts directly into the Plans & Subscriptions layer.
- Clients list — 57 records with Client / Lawyer type
- Search by name / email / phone, filter by status
- Per-client subscription, credit and file quota view
- CSV / Excel / Print export on the full list
Newsletter Subscriptions
The marketing opt-in layer — every email captured from the public site's newsletter footer lands here with subscription date, status and source page, ready to be exported to the ESP without a developer round-trip.
- Email + status + subscription date per entry
- Source page captured for attribution
- Unsubscribe handling with audit trail
- CSV / Excel export ready for the ESP
Plans Catalog
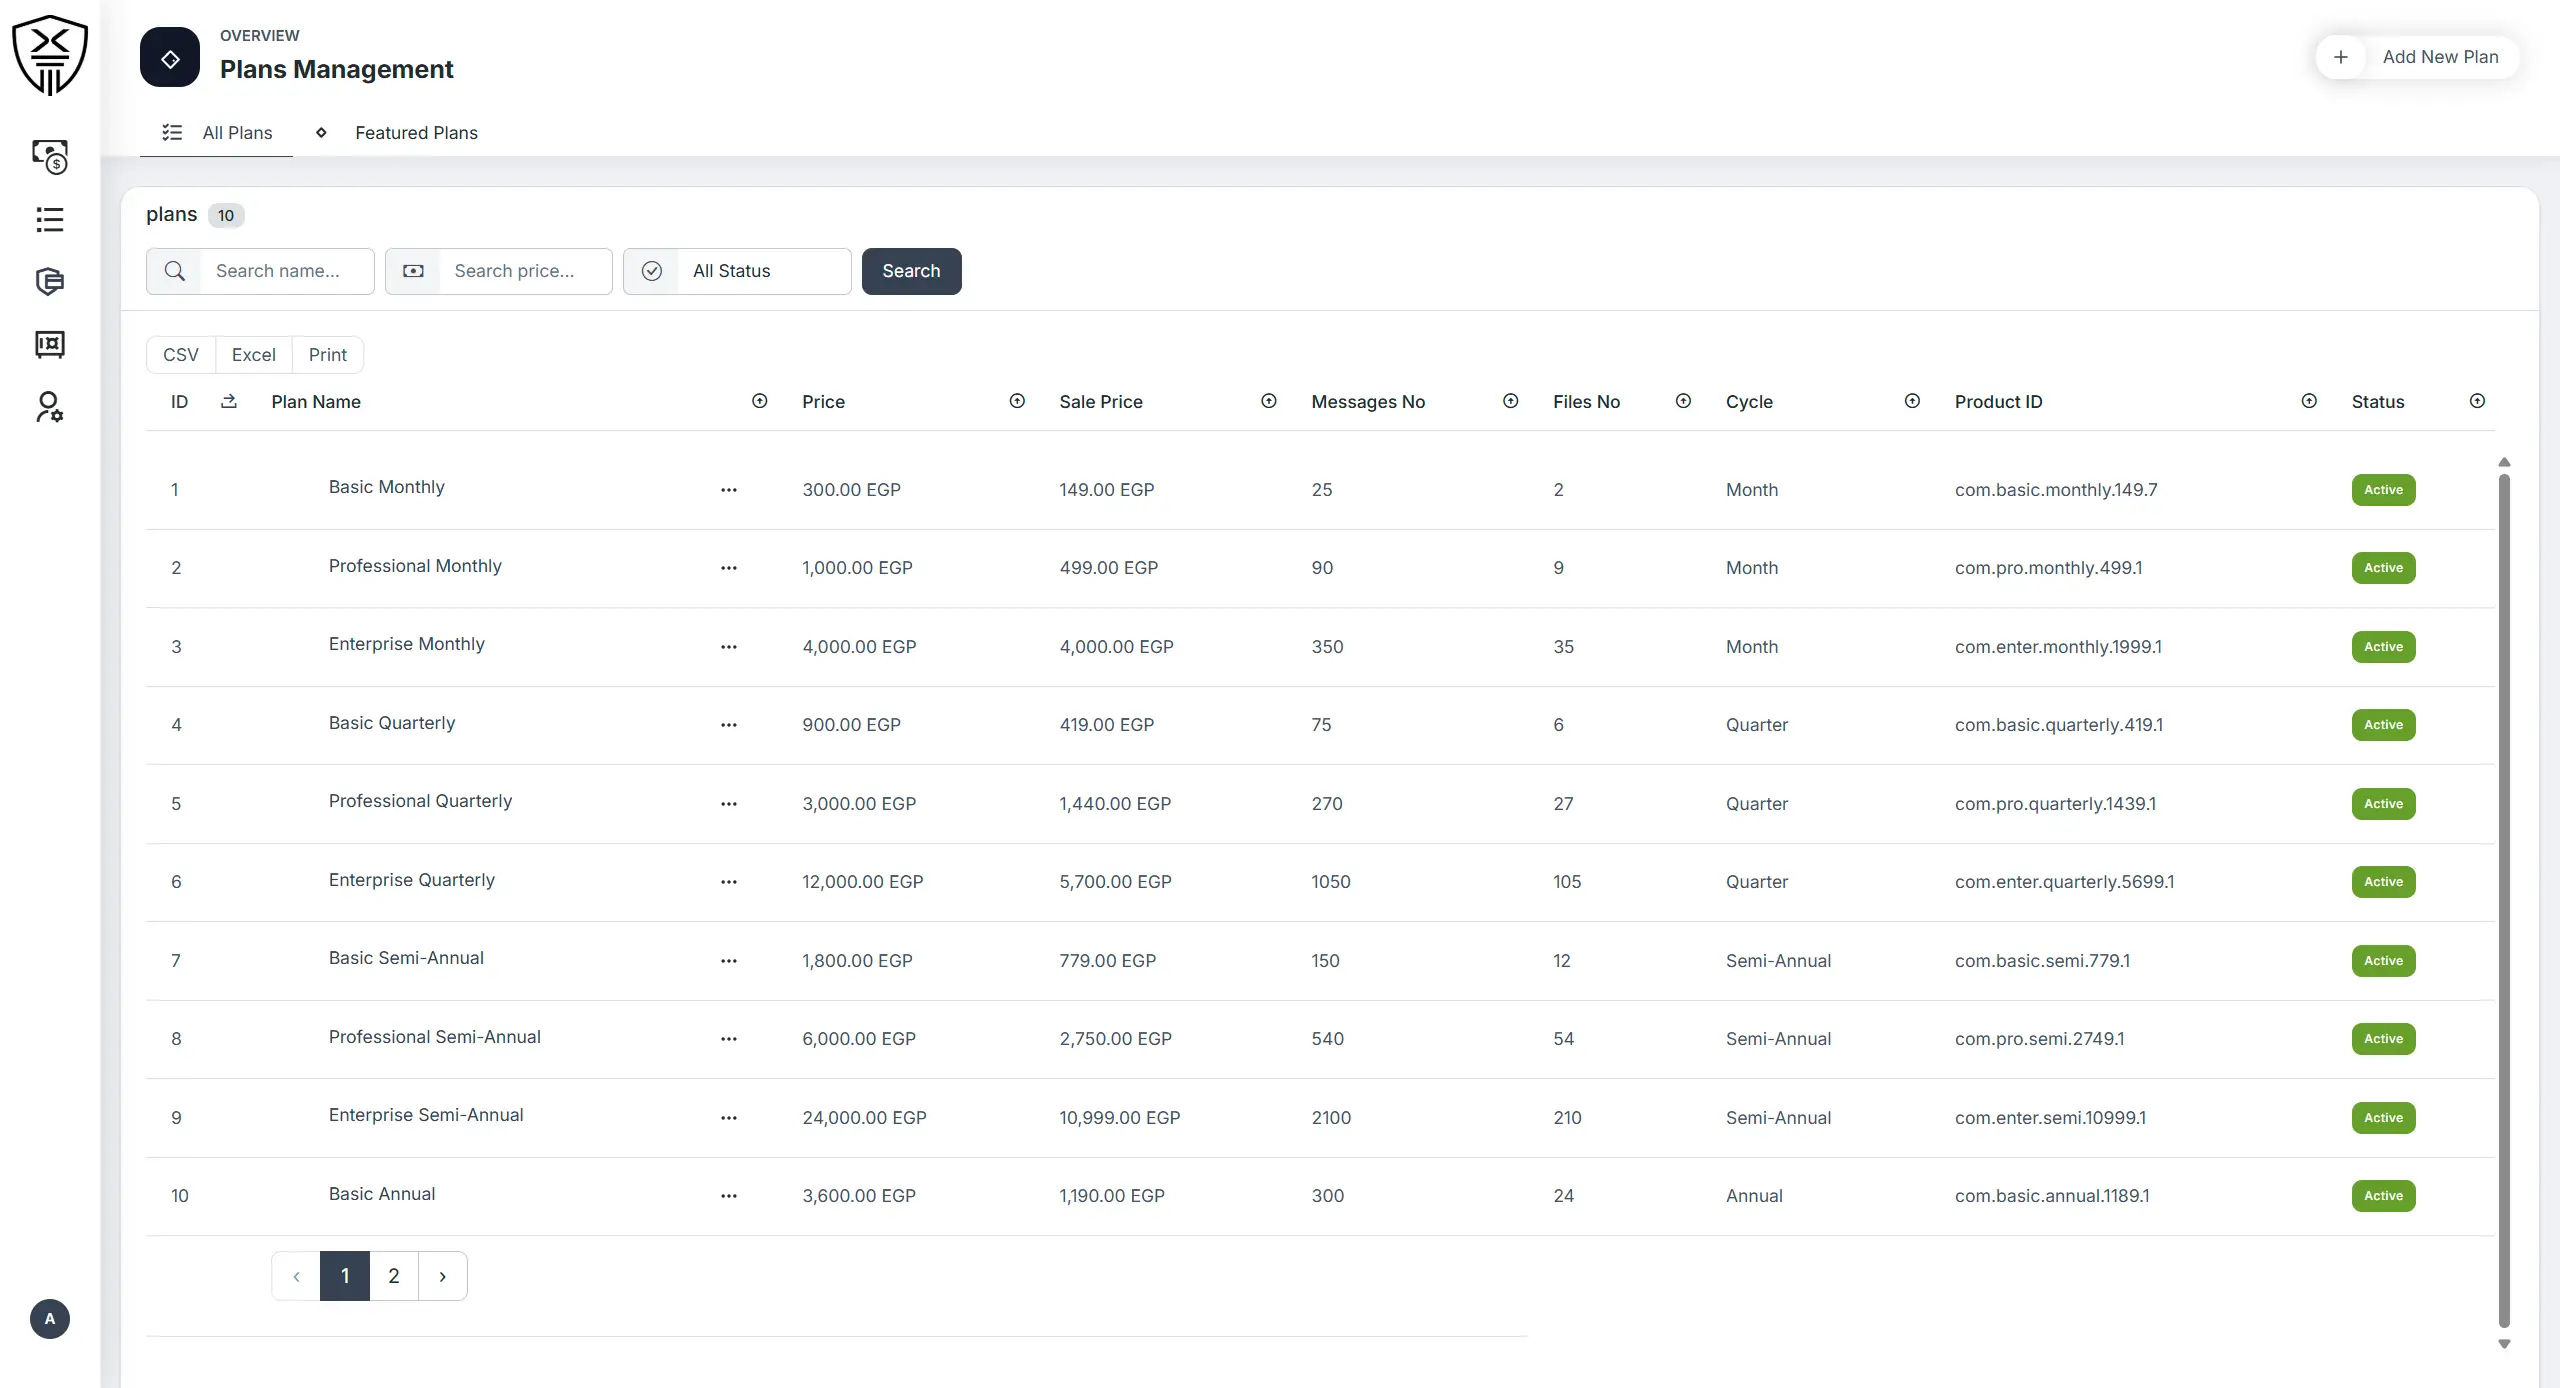
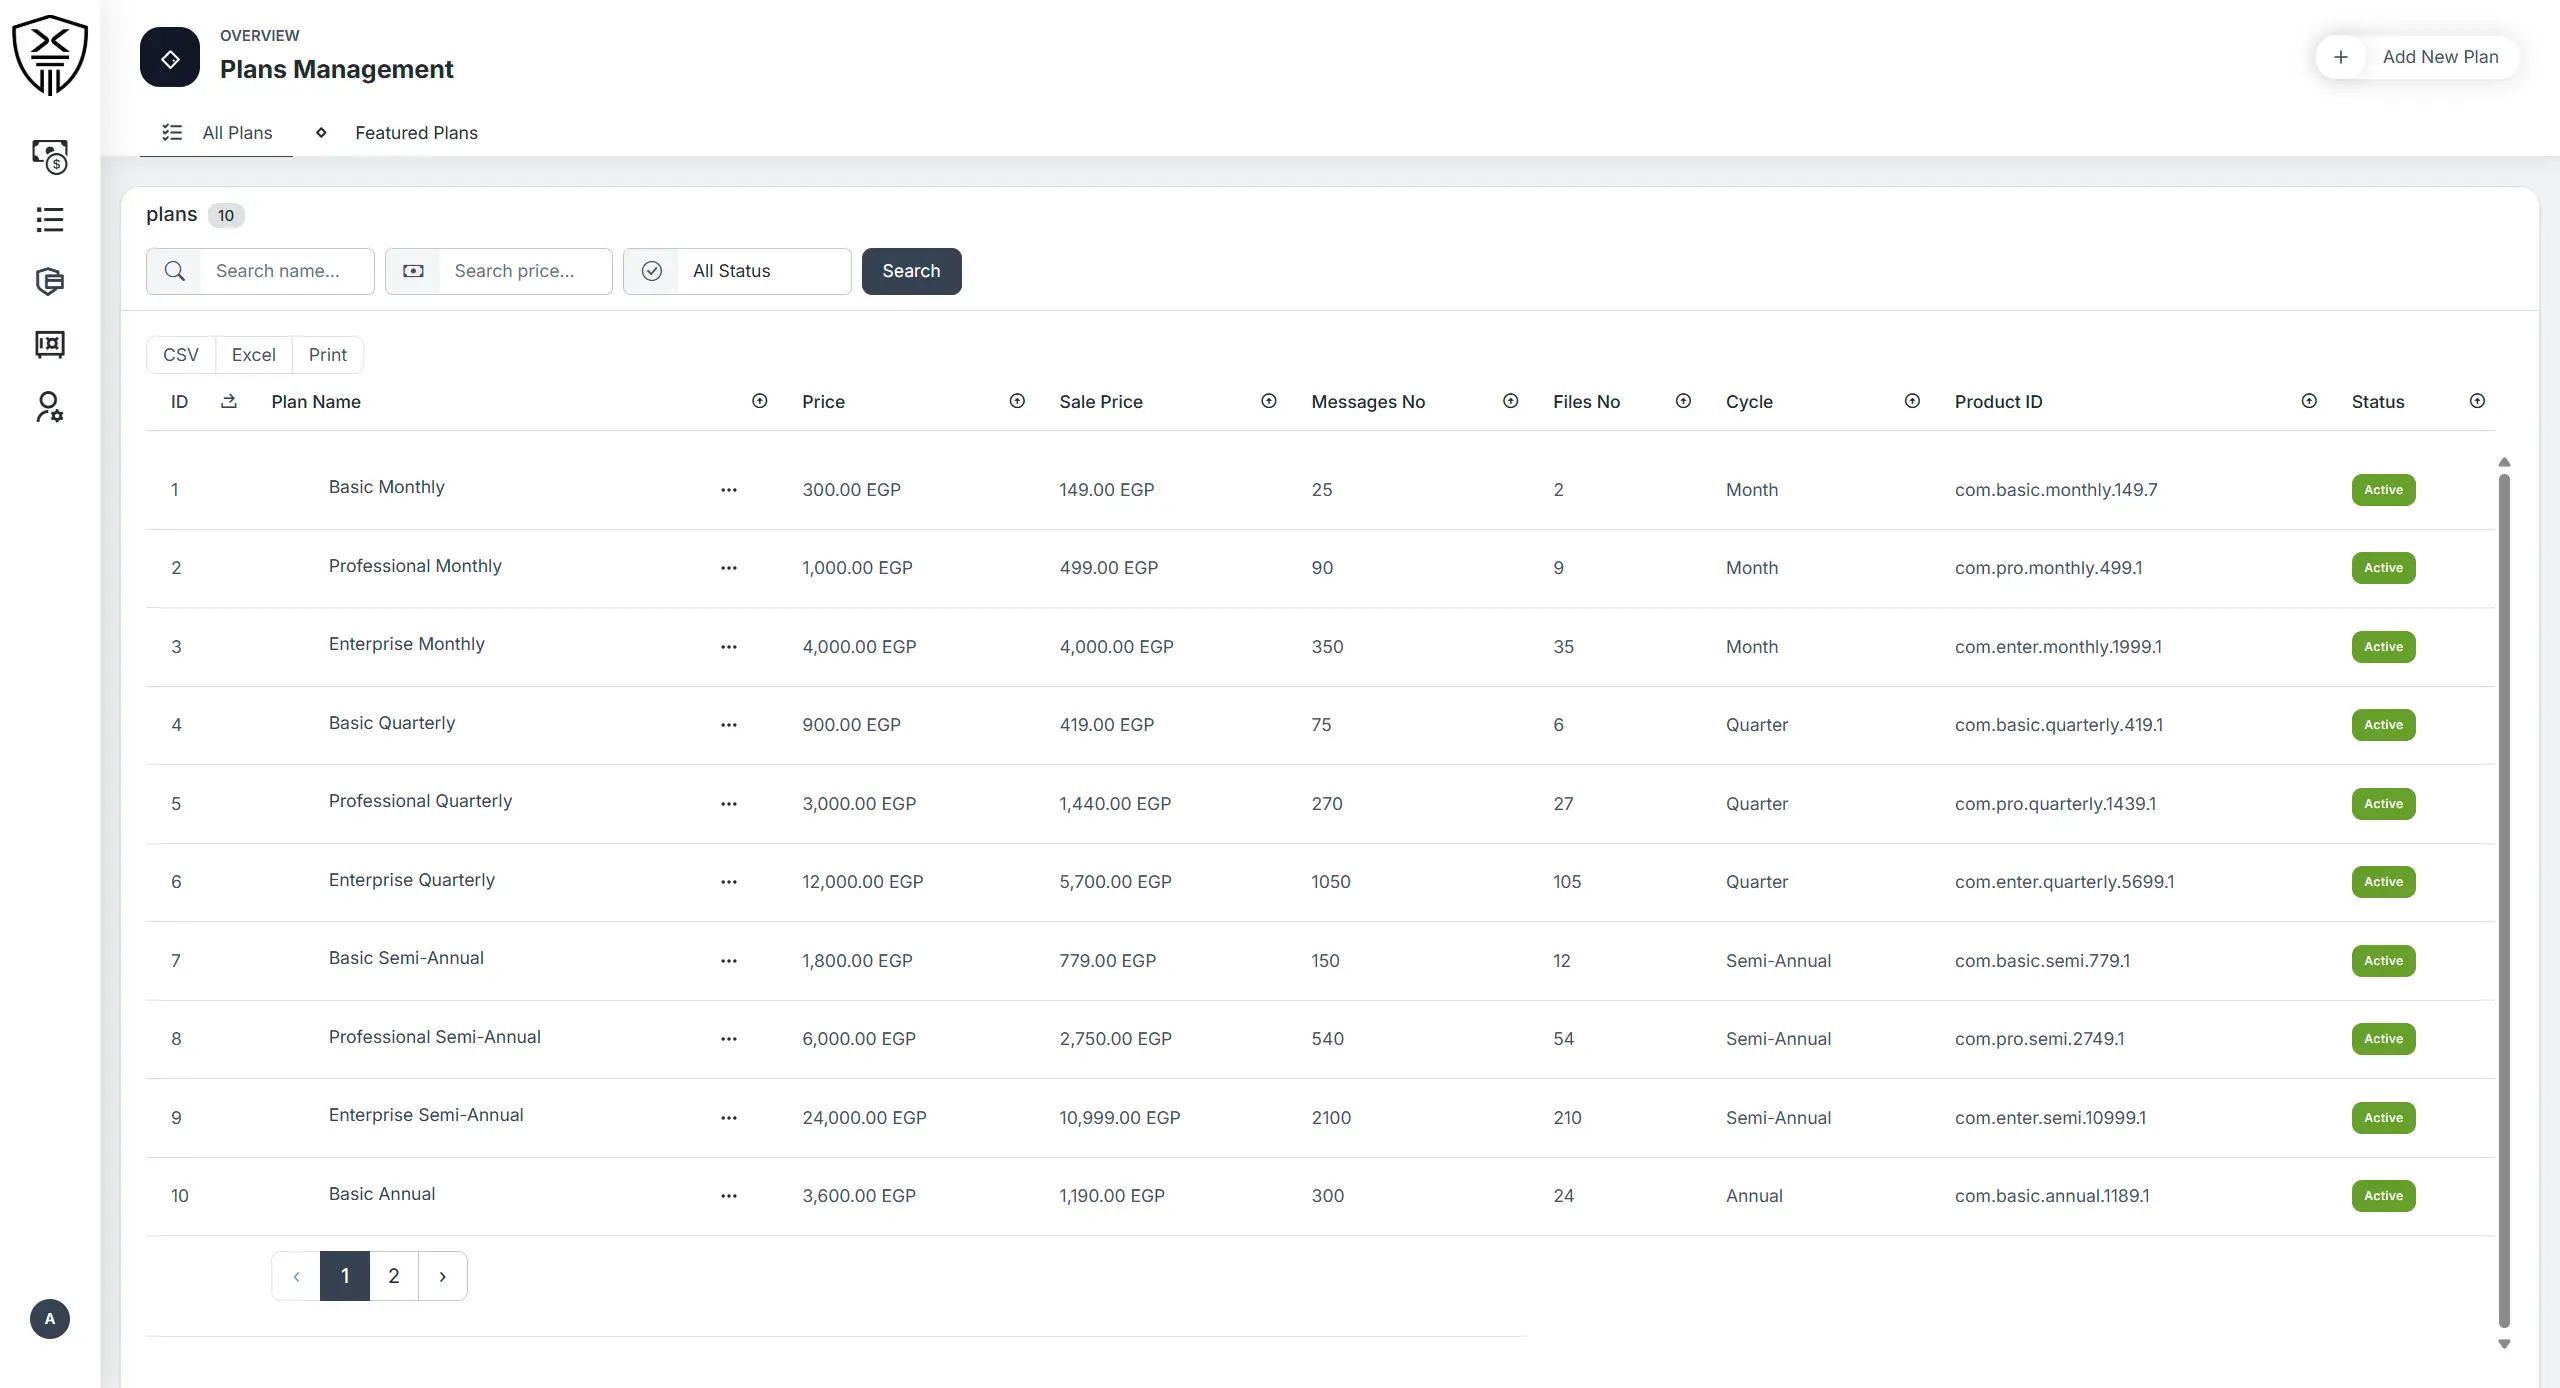
The pricing engine. 10 plans across Basic / Professional / Enterprise tiers in four cycles (Monthly, Quarterly, Semi-Annual, Annual) — every plan tied to a Paymob / Apple Product ID, with credit and file quotas locked at the entitlement layer.
- 10 plans × 3 tiers × 4 cycles in EGP
- Credit + file quota per plan as entitlement source
- Paymob + Apple Product ID mapped per SKU
- Sale-price column toggled per cycle
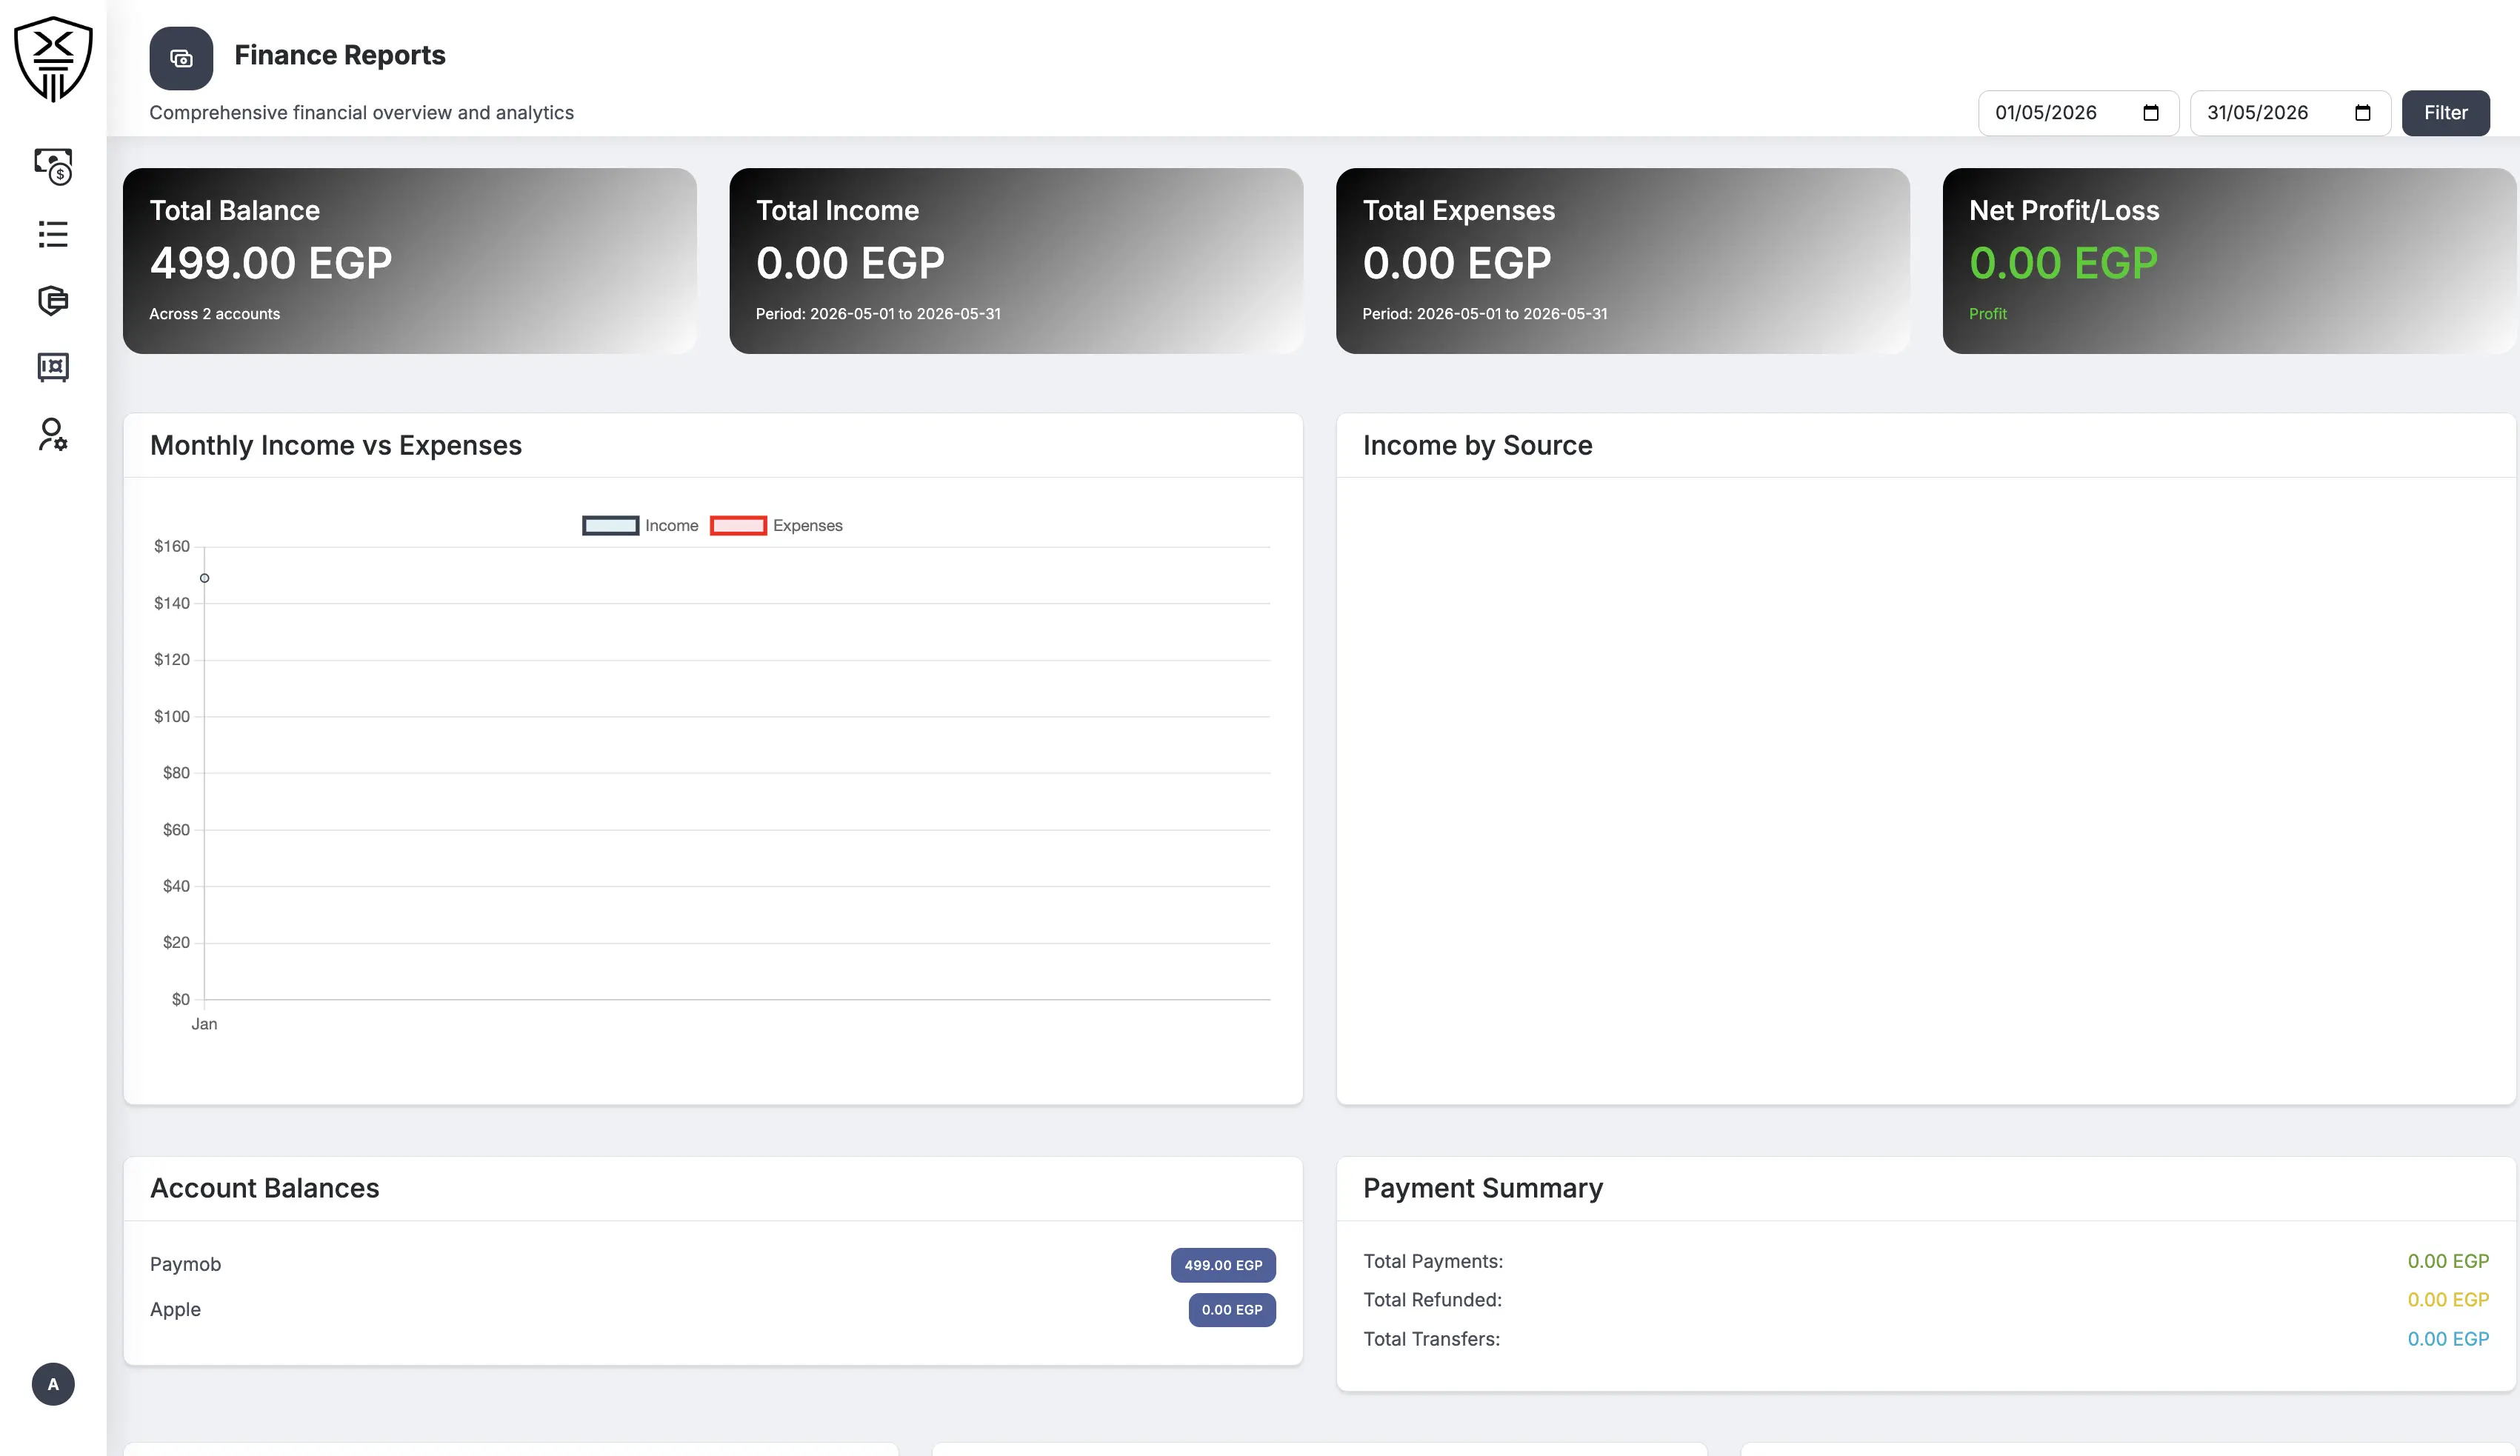
Finance Reports
A double-entry-style cash layer covering Income Sources, Income entries, Expense Sources, Expenses and inter-account Transfers — surfaced as a P&L report with Total Balance, Total Income, Total Expenses and Net Profit / Loss, plus a Monthly Income vs Expenses chart under one date filter.
- P&L at a glance — balance, income, expenses, net
- Monthly Income vs Expenses chart with date filter
- Income by Source breakdown + Payment Summary tiles
- CSV / Excel / Print export on every cash report
Jump to another chapter
Need a admin dashboard like this?
If your product is a model wrapped in a Notion doc, that's exactly the gap we close — billing, admin, multilingual, security, and all. Let's talk.